

Abstract
How and where in the brain audio-visual signals are bound to create multimodal objects remains unknown. One hypothesis is that temporal coherence between dynamic multisensory signals provides a mechanism for binding stimulus features across sensory modalities in early sensory cortex. Here we report that temporal coherence between auditory and visual streams enhances spiking representations in auditory cortex. We demonstrate that when a visual stimulus is temporally coherent with one sound in a mixture, the neural representation of that sound is enhanced. Supporting the hypothesis that these changes represent a neural correlate of multisensory binding, the enhanced neural representation extends to stimulus features other than those that bind auditory and visual streams. These data provide evidence that early cross-sensory binding provides a bottom-up mechanism for the formation of cross-sensory objects and that one role for multisensory binding in auditory cortex is to support auditory scene analysis.
When listening to a sound of interest, we frequently look at the source. However, how auditory and visual information are integrated into a coherent perceptual object is unknown. The temporal properties of a visual stimulus can be exploited to detect correspondence between auditory and visual streams 1–3, can bias the perceptual organisation of a sound scene 4, and can enhance or impair listening performance depending on whether the visual stimulus is temporally coherent with a target or distractor sound stream 5. Together, these behavioural results suggest that temporal coherence between auditory and visual stimuli can promote binding of cross-modal features to enable the formation of an auditory-visual (AV) object 6.
Visual stimuli can both drive and modulate neural activity in primary and non-primary auditory cortex 7–11 but the contribution that visual activity in auditory cortex makes to auditory perception remains unknown. One hypothesis is that the integration of cross-sensory information into early sensory cortex provides a bottom-up substrate for the binding of multisensory stimulus features into a single perceptual object 6. We have recently argued that binding is a distinct form of multisensory integration that underpins perceptual object formation, and can be separated from other sorts of integration by demonstrating a benefit in the behavioural or neural discrimination of a stimulus feature orthogonal to the features that link crossmodal stimuli (Fig. 1a). Therefore, in order to demonstrate binding an appropriate crossmodal stimulus should elicit not only enhanced neural encoding of the stimulus features that bind auditory and visual streams, but that there should be enhancement in the representation of other stimulus features associated with the source (Fig. 1c).

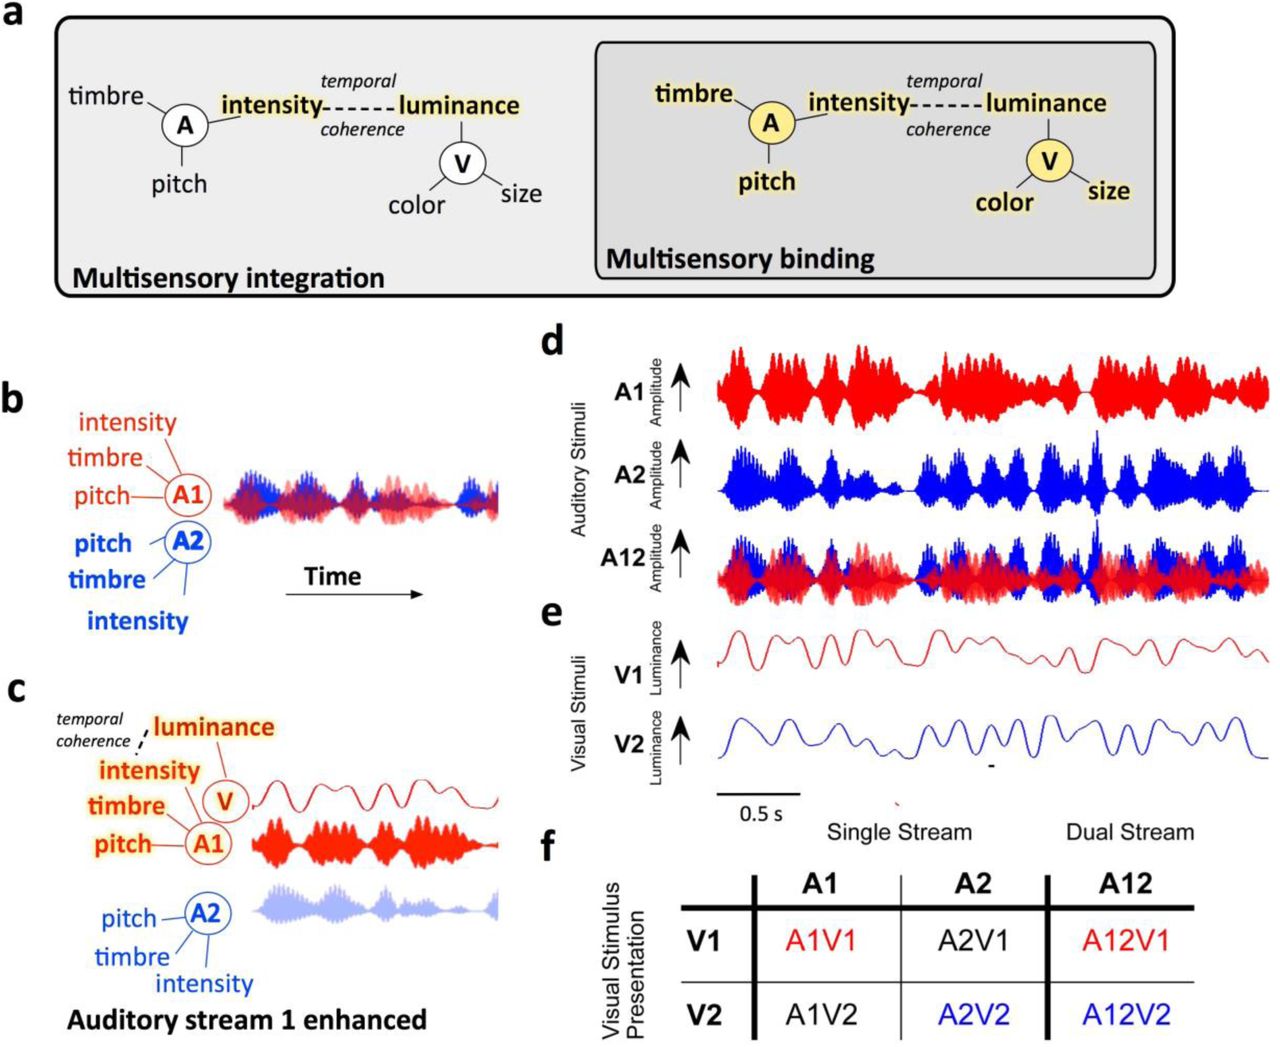
a Conceptual model illustrating how binding can be identified as a distinct form of multisensory integration. Multisensory binding is defined as a subset of multisensory integration which results in the formation of a crossmodal object. During binding, all features of the audio-visual object are linked and enhanced including both those features that bind the stimuli across modalities (here temporal coherence between auditory (A) intensity and visual (V) luminance) and orthogonal features such as auditory pitch and timbre and visual color and size. Other forms of multisensory integration would result in only the features that promote binding being enhanced - here auditory intensity and visual luminance. To identify binding therefore requires a demonstration that non-binding features (e.g. here pitch, timbre, color or size) are enhanced b When two competing sounds (red and blue waveforms) are presented they can be separated on the basis of their features, but may elicit overlapping neuronal representations in auditory cortex. c Hypothesised enhancement in auditory stream segregation when a temporally coherent visual stimulus enables multisensory binding. When the visual stimulus changes coherently with the red sound (A1, top) this sound is enhanced and the two sources are better segregated. Perceptually this would result in enhanced auditory scene analysis and an enhancement of the non-binding features. d Stimuli design: Auditory stimuli were two artificial vowels (denoted A1 and A2), each with distinct pitch and timbre and independently amplitude modulated with a noisy low pass envelope. e Visual stimulus: a luminance modulated white light was presented with one of two temporal envelopes derived from the amplitude modulations of A1 and A2. f illustrates the stimulus combinations that were tested experimentally in single stream (a single auditory visual pair) and dual stream (two sounds and one visual stimulus) conditions.
Here we test the hypothesis that the incorporation of visual information into auditory cortex can determine the neuronal representation of an auditory scene through multisensory binding (Fig.1). We demonstrate that when visual luminance changes coherently with the amplitude modulations of one sound stream in a mixture, the neural representation of that sound stream is enhanced in the auditory cortex. Consistent with these effects reflecting cross-modal binding, the encoding of auditory timbre, an orthogonal stimulus dimension, is subsequently enhanced in the temporally coherent auditory stream.
Results
We recorded neuronal responses in the auditory cortex of awake (n=9 ferrets, 221 single units, 311 multi-units) and medetomidine-ketamine anesthetised ferrets (n=5 ferrets, 426 single units, 772 multi units) in response to naturalistic time-varying auditory and visual stimuli adapted from Maddox et al5. Recordings in anesthetized animals allowed us to isolate bottom-up attention-independent processing, permitted longer recording durations for additional control stimuli and enabled simultaneous characterization of neural activity across cortical laminae. Recordings in awake animals while they held their head at a drinking spout but were not engaged in a behavioral task allowed us to measure neural activity free from any confounds associated with pharmacological manipulation and in the absence of task-directed attention. The auditory streams were two vowels with a distinct pitch and timbre (denoted A1: [u], fundamental frequency (F0) = 175 Hz and A2: [a], F0 = 195 Hz) each of which was independently amplitude modulated with a low-pass (<7 Hz) envelope (Fig. 1d). A full-field visual stimulus accompanied the auditory stimuli, the luminance of which was temporally modulated with a modulation envelope from one of the two auditory streams (Fig. 1e). We tested stimulus conditions in which a single AV stimulus pair was presented (‘single stream’ stimuli), where the auditory and visual streams could be temporally coherent (A1V1, A2V2) or independently modulated (A1V2, A2V1). We also tested a dual auditory stream condition in which both auditory streams were presented and the visual stimulus was temporally coherent with one of the auditory streams (A12V1 or A12V2, Fig. 1e).
Spike patterns in auditory cortex differentiate dynamic auditory-visual stimuli
Before exploring the impact of temporal coherence between auditory and visual stimuli on auditory cortical neurons, we first used the responses to single stream stimuli to classify neurons according to whether they were modulated primarily by auditory or visual temporal dynamics. To determine whether the auditory amplitude envelope reliably modulated spiking we used a spike-pattern classifier to decode the auditory stream identity, collapsed across visual stimuli (i.e. we decoded auditory stream identity from the combined responses to A1V1 and A1V2 stimuli and the combination of A2V1 and A2V2 responses). An identical approach was taken to determine if neuronal responses reliably distinguished visual modulation (i.e. we decoded visual identity from the combined responses to A1V1 and A2V1 stimuli and the combined responses elicited by A1V2 and A2V2). Neuronal responses which were informative about auditory or visual stimulus identity at a level better than chance (estimated with a bootstrap resampling) were classified as auditory-discriminating (Fig. 2a-b) and / or visual-discriminating (Fig. 2c-d) respectively.

A pattern classifier was used to determine whether neuronal responses were informative about auditory or visual stimuli. The responses to single stream stimuli are shown for two example units, with responses grouped according to the identity of the auditory (a, b, auditory discriminating unit) or visual stream (c, d, visual discriminating unit). In each case the stimulus amplitude (a,b) / luminance (c,d) waveform is shown in the top panel with the resulting raster plots (20 trials per condition) and peri-stimulus time histogram (20 ms bin) below. e, f: Decoder performance (mean ± SEM) for discriminating stimulus identity (coherent: A1V1 vs. A2V2; independent: A1V2 vs. A2V1) in auditory and visual classified units recorded in awake (e) and anaesthetised (f) ferrets. Pairwise comparisons for decoding of coherent versus independent stimuli: p<0.001 (***, see results).
In awake animals, 39.5% (210/532) of units were auditory-discriminating, 11.1% (59/532) were visual-discriminating, and only 0.38 (2/532) discriminated both auditory and visual stimuli. Overall a smaller proportion of units represented the identity of auditory or visual streams in the anesthetised dataset: 20.2% (242/1198) were auditory-discriminating, 6.8% (82/1198) were visual-discriminating, and 0.58% (7/1198) discriminated both.
During recordings made under anaesthesia, we also recorded responses to noise bursts and white-light flashes (both 100 ms) presented separately and together to map AV responsiveness in auditory cortex (Bizley et al., 2007). Specifically, responsiveness was defined using a two-way ANOVA (factors: auditory stimulus [on/off] and visual stimulus [on/off]) on spike counts measured during stimulus presentation. We defined units as being sound-driven (main effect of auditory stimulus, no effect of visual stimulus or interaction), light-driven (main effect of visual stimulus, no effect of auditory stimulus or interaction) or both (main effect of both auditory and visual stimuli or significant interaction; p < 0.05). Using such stimuli revealed that the classification of units by visual / auditory discrimination of single stream stimuli selected a subset of light or sound driven units and that the proportions of auditory, visual and AV units recorded in our sample were in line with previous studies (Bizley et al, 2007: 65.1% (328/504) of units were driven by noise bursts, 16.1% (81/504) by light flashes and 14.1% (71/504) by both.
We hypothesised that temporal coherence between auditory and visual stimuli would enhance the discriminability of neural responses, irrespective of a unit's classification as auditory or visual discriminating. We confirmed this prediction by comparing discrimination of temporally coherent (A1V1 vs. A2V2) and temporally independent (A1V2 vs. A2V1) stimuli (Fig. 2e, f): Temporally coherent AV stimuli produced more discriminable spike patterns than those elicited by temporally independent ones in both awake (Fig. 2e, pairwise t-test, auditory-discriminating t418 = 34.277, p<0.001; visual-discriminating t116 = 13.327, p<0.001; All t540 = 35.196, p<0.001) and anesthetised recordings (Fig.2f, auditory-discriminating t482 = 27.631, p<0.001; visual-discriminating t162 = 22.907, p<0.001; All t664 = 33.149, p<0.001).
What might underlie the enhanced discriminability observed for temporally coherent cross-modal stimuli? The phase of low frequency oscillations determines the excitability of the surrounding cortical tissue12–14, is reliably modulated by naturalistic stimulation15–19 and has been implicated in multisensory processing20,21. We hypothesised that sub-threshold visual inputs could modulate spiking activity by modifying the phase of the local field potential such that phase coupling to temporally coherent sounds is enhanced. This in turn would provide a mechanism by which neuronal spiking was enhanced when auditory and visual streams are temporally coherent.
Dynamic visual stimuli elicit reliable changes in LFP phase
Stimulus evoked changes in the local field potential (LFP) were evident from the recorded voltage traces and analysis of cross-trial phase coherence demonstrated that there were reliable changes in phase across repetitions of identical AV stimuli (Fig. 3 a, b). To isolate the influence of visual activity on the LFP for each unit, and address the hypothesis that visual stimuli elicited reliable changes in the LFP, we calculated phase and power dissimilarity functions for stimuli with identical auditory signals but differing visual stimuli17. Briefly, this analysis assumes that if the phase (or power) within a particular frequency band differs systematically between responses to two different stimuli, then inter-trial phase coherence (ITPC) across repetitions of a single stimulus will be greater than across randomly selected stimuli. For each frequency band in the LFP, we therefore compared “within-stimulus” ITPC for responses to each stimulus (A1 stream Fig. 3c; A2 stream Fig. 3d) with “across-stimulus” ITPC calculated from stimuli with identical auditory stimuli but randomly selected visual stimuli (e.g. randomly drawn from A1V1 and A1V2; Fig. 3c). The difference between within-stimulus and across-stimulus ITPC was then calculated across frequency and described as the phase dissimilarity index (PDI) (Fig. 3e, f) with positive PDI values indicating reliable changes in phase coherence elicited by the visual component of the stimulus.

a, b Example LFP responses to single stream stimuli across visual conditions. Data obtained from the recording site at which multiunit spiking activity discriminated auditory stream identity in Fig. 2 a and b. The amplitude waveforms of the stimuli are shown in the top panel, with the evoked LFP underneath (mean across 21 trials). The resulting inter-trial phase coherence (ITPC) values are shown in the bottom two panels. c, d ITPC was calculated for coherent and independent AV stimuli separately and compared to a null distribution (ITPC across). Single stream phase dissimilarity values (PDI) were calculated by comparing ITPC values to the ITPC across condition (e, f).
We calculated PDI values for each of the four single stream stimuli and grouped conditions by coherency (coherent: A1V1 / A2V2, or independent: A1V2 / A2V1). To determine at what frequencies the across-trial phase reliability was significantly positive, we compared within-stimulus and across-stimulus PDI for each frequency band (paired t-test with Bonferroni correction for 43 frequencies, α = 0.0012). In awake subjects we identified a restricted range of frequencies between 10 and 20 Hz where visual stimuli enhanced the phase reliability (Fig. 4a, b). In anesthetised animals, average PDI values were larger than in awake animals and all frequencies tested had single stream PDI values that were significantly positive (Fig. 4d, e). We therefore conclude that visual stimulation elicited reliable changes in the LFP phase in auditory cortex. In contrast to LFP phase, a parallel analysis of across trial power reliability showed no significant effect of visual stimuli on LFP power in any frequency band (Supplementary Fig. 1).

Mean inter-trial phase coherence (ITPC) values across frequency for coherent (a, d) and independent (b, e) conditions. Dots indicate frequencies at which the ITPC values were significantly greater than chance (Pairwise ttest, α = 0.0012, Bonferroni corrected for 43 frequencies). c f: Mean (±SEM) single stream phase dissimilarity index (PDI) values for coherent and independent stimuli in awake (c) and anaesthetised (f) animals. Black dots indicate frequencies at which the coherent stream PDI is significantly greater than in the independent conditions (p<0.001).
Next we asked whether there were any frequencies at which phase coherence was increased by AV temporal coherence by performing a pairwise comparison of single stream PDI values, yielded from temporally coherent and independent stimuli, for all frequency points. In anaesthetised animals, the single stream PDI did not differ between coherent and independent stimuli at any frequency (Fig. 4f). In awake animals, PDI values were similar for temporally coherent and temporally independent stimuli, except in the 11-14 Hz band where coherent stimuli elicited significantly greater phase coherence (Fig. 4c). Together these data suggests that visual inputs modulate the phase of the low frequency field potential in auditory cortex independently of temporal coherence with auditory stimuli, and are consistent with auditory cortical neurons integrating visual and auditory information such that discriminability of spiking responses to temporally coherent auditory visual signals are enhanced (Fig.2e, f).
Visual information enhances the representation of the temporally coherent auditory stream in a sound mixture
Arguably the greatest challenge for the auditory brain is to reconstruct sound sources in the world from their overlapping cochlear representations. Having demonstrated that temporal coherence between auditory and visual stimuli enhances discriminability of auditory spiking responses, we next asked whether the temporal dynamics of a visual stimulus could enhance the representation of one sound in a mixture. We therefore recorded responses to auditory scenes composed of two sounds (A1 and A2) presented simultaneously with a visual stimulus that was temporally coherent with one or other auditory stream (A12V1 or A12V2). To test if a visual stimulus could enhance the representation of the temporally coherent auditory stream in such dual stream stimuli we then compared dual stream responses with responses to temporally coherent single stream stimuli.
Figure 5 illustrates this approach for a single unit: responses to the single stream AV stimuli (Fig. 5a) formed templates against which we judged the similarity of responses to the dual stream stimuli (Fig. 5b). Responses to the dual stream stimuli more closely resembled A1V1 when the visual stimulus was V1, and A2V2 when the visual stimulus was V2. In our analysis of single-stream encoding, this unit was classified as visual-discriminating, but many auditory-discriminating units showed similar response properties (e.g. Supplementary Fig. 2). Enhancement of the coherent auditory stimulus representation was visible at the population level (Fig. 5c-f): Auditory cortical responses to dual-stream stimuli most closely resembled responses to the single stream stimulus with the same visual component. This finding was robust in both awake (Fig. 5d, pairwise t-test: t540 = 6.073, p<0.001) and anesthetised animals (Fig. 5f, t660 = 9.5137, p<0.001) suggesting that these effects were not mediated by attention.

Spiking responses from an example unit (visual classified unit from the awake dataset) in response to a, single stream AV stimuli used as decoding templates and b, dual stream stimuli, rasters and PSTH responses stimuli from which single trial responses were classified. When the visual component of the dual stream was V1, the majority of trials were classified as A1V1 (82% (19/23) of trials), and A2V2 when the visual stimulus was V2 (26% (6/23) of responses classified as A1V1 (see also green datapoint in c).). c-f data for awake (c,d) and anesthetised (e,f) datasets. In each case the left panel (c,e) shows the distribution of decoding values according to the visual condition and the right panel (d,f) shows the population mean (± SEM) Pairwise comparisons revealed significant effect of visual conditionI on decoding in both datasets (p<0.001).
Modulation of dual stream responses by visual stimulus identity was not simply a consequence of the shared visual component of single stream and dual stream stimuli (Fig. 6). To show this we decoded responses to dual stream stimuli (A12V1 and A12V2) using responses to auditory-only stimuli (Fig. 6a; A1 or A2). We also analysed responses to mixed auditory streams with no visual stimulus (A12) using responses either to coherent single stream stimuli (A1V1, A2V2). A two-way repeated measures ANOVA on the decoder responses with factors of visual stream (V1, V2, no visual), and template type (AV or A) demonstrated a significant effect of visual stream identity on dual stream decoding (Fig. 6d, F(2, 528) = 19.320, p <0.001), but there was no effect of template type ( F(1, 528) = 0.073, p = 0.787) or interaction between factors (F(2, 528) = 0.599, p = 0.550). Post-hoc comparison across units revealed that without visual stimulation there was no tendency to respond preferentially to either stream but that visual stream identity significantly influenced classification of dual stream responses.

In an additional control experiment (n=89 units recorded in awake animals), the responses to coherent AV and auditory-only (A Only) single stream stimuli were used as templates to decode dual stream stimuli either accompanied by visual stimuli (V1/V2) or in the absence of visual stimulation (no visual). Spiking responses from an example unit in response to a, single stream stimuli (A only, no visual) used as decoding templates and b, dual stream stimuli, in each case the auditory waveform, rasters and PSTHs are shown. A two-way ANOVA with template type and visual condition as factors revealed significant effects of visual condition but not template type. Post-hoc comparisons demonstrated that classification was significantly influenced by visual stimulus identity when both A only and AV templates were used. The proportion of responses classified as A1 when the visual stimulus was V1 or V2 are shown in c and d, Mean (± SEM) values for these units. Pairwise comparisons revealed significant effect across visual conditions in both datasets (p<0.001).
The ability of a visual stimulus to modulate auditory representation in the dual stream condition was observed across all cortical layers (defined by current source density analysis, see online methods, Supplemental Fig. 3a,b) and across three tonotopic fields (Supplemental Fig. 3c,d) of anaesthetized subjects. While present in all effects, the influence of the visual stimulus was strongest in the supra-granular layers (supplemental Fig.3b). Thus cross-modal modulation by temporal coherence was a general phenomenon across auditory cortex. Separating auditory, visual, and auditory-visual units according to responsiveness to classic neurophysiological stimuli (noise bursts and light flashes) revealed that the impact of a visual stimulus on the representation of a sound mixture was present across functional sub-populations but strongest in visual and auditory-visual units (Supplemental Fig. 4). Finally, we observed these effects in both single and multi-units (Supplemental Fig.5).
Visual stimuli elicit changes in LFP phase in the context of an auditory scene
Our findings indicate that visual stimuli can shape the representation of auditory mixtures and that temporal coherence between auditory and visual stimuli enhances across-trial phase coherence. To understand whether changes in phase coherence could provide a mechanism for visual modulation of auditory representations, we again generated within-stimulus ITPC for each dual-stream stimulus (Fig. 7a, A12V1 and A12V2) and across-stimulus ITPC by randomly selecting responses across visual conditions (Fig. 7b). We then expressed the difference as the dual stream PDI (dual stream phase dissimilarity index, Fig. 7c). Since the auditory components were identical in each dual stream stimulus, the influence of the visual component on LFP phase could be isolated as non-zero dual stream PDI values (paired t-test, bonferoni corrected, α = 0.0012). In awake animals, dual stream PDI was significantly greater than zero at 11-14Hz and 16-19 Hz (Fig. 7d, e) whereas in anesthetised animals, we found positive dual stream PDI values across all frequencies tested (Fig. 7f, g). In anesthetised animals where we were able to use the responses of units to noise and light flashes to categorise units as auditory, visual or auditory-visual, we also confirmed significant PDI values in each of these subpopulations of units (Supplemental Fig. 4c). In awake animals, we confirmed the significance of PDI values in the 11-14 Hz range across different rates of amplitude modulation of the auditory stimulus (Supplemental Fig. 6).
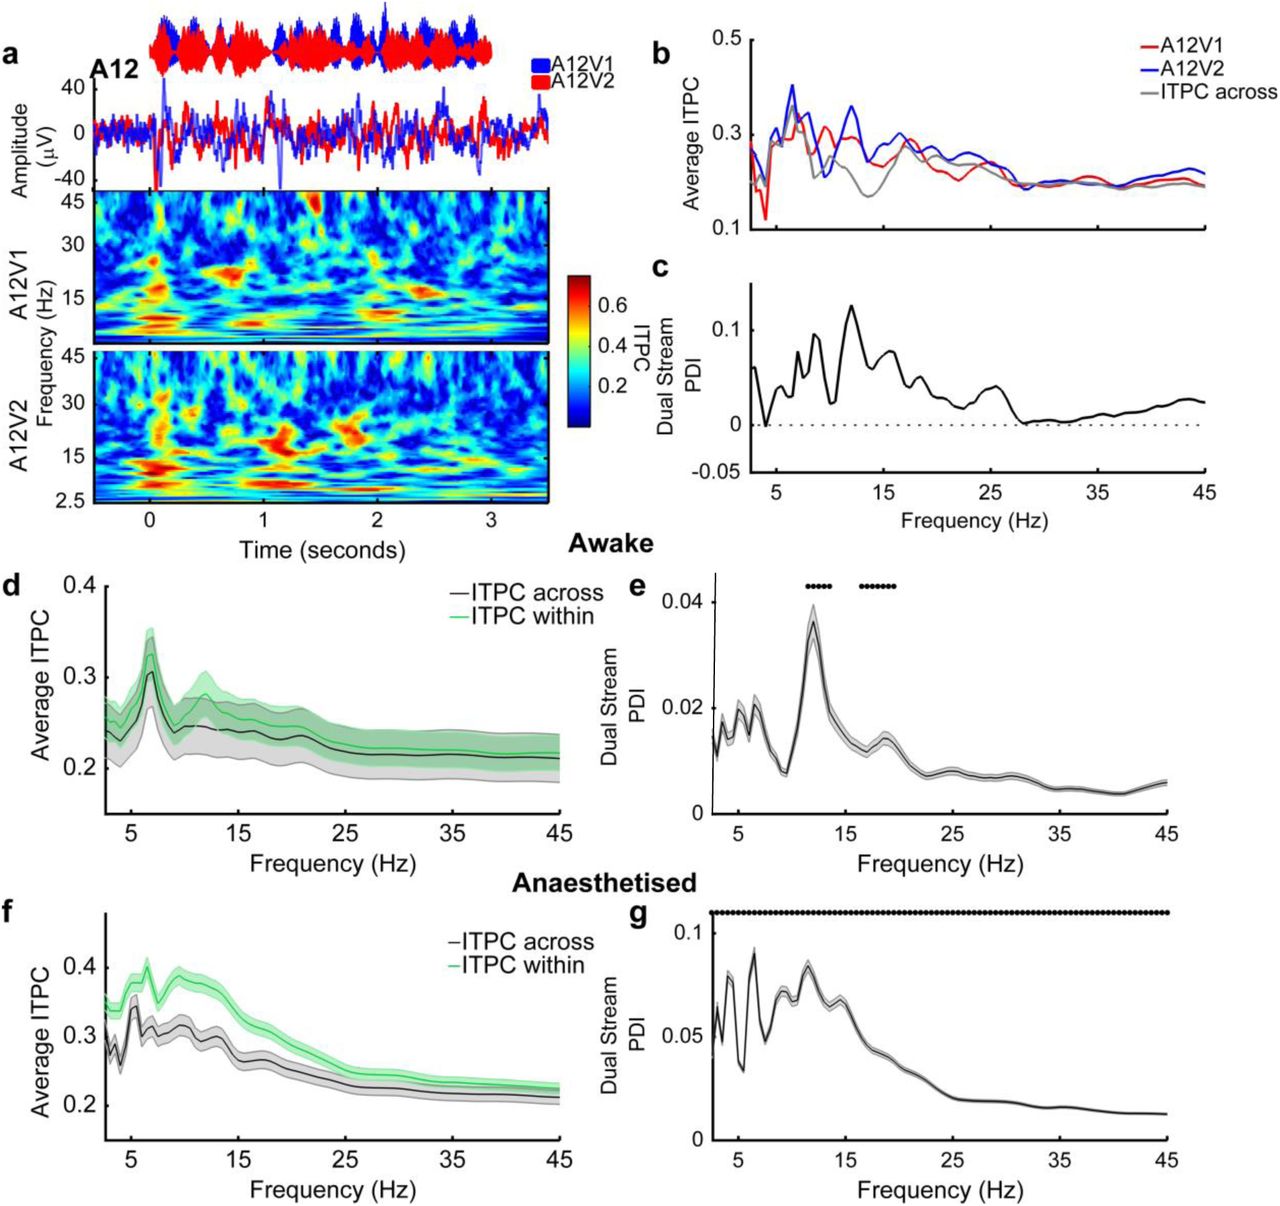
a, Auditory stimulus waveform (top), evoked LFP (middle) and resulting inter-trial phase coherency plots (bottom) for a typical recording site in response to dual stream stimuli. b, ITPC values were calculated across frequency for responses to dual stream stimuli with identical visual stimuli (‘ITPC within’) and across randomly drawn visual stimuli (‘ITPC-across’, grey). Dual stream phase selectivity index (PDI) values were then calculated as the difference between shuffled and dual stream ITPC (c). d, f Average ITPC (± SEM) for dual stream ITPC-within and ITPC-across for awake and anaesthetised animals. Symbols indicate where the dual stream PDI was significant (pairwise t-test for ITPC within versus ITPC across, α = 0.0012 with correction). e, g Mean (± SEM) dual stream PDI values for awake and anaesthetised animals.
Neural responses to auditory timbre deviants are enhanced when changes in visual luminance and auditory intensity are temporally coherent
A hall-mark of an object-based rather than feature-based representation is that all stimulus features are bound into a unitary perceptual construct, including those features which do not directly mediate binding22. We predicted that binding across modalities would be promoted via synchronous changes in auditory intensity and visual luminance (Fig. 1b) and observed that the temporal dynamics of the visual stimulus enhanced the representation of temporally coherent auditory streams (Fig. 2e-f and 5d-f). To determine whether temporal synchrony of visual and auditory stimulus components also enhanced the representation of orthogonal stimulus features (Fig. 1c) and thus fulfil a key prediction of binding, we introduced brief timbre perturbations into our dual stream stimuli (n = 4 deviants, two in A1 and two in A2). Such deviants could be detected by human listeners and were better detected when the auditory stream in which they were embedded was temporally coherent with an accompanying visual stimulus5. We hypothesised that, despite containing no information about the occurrence of deviants, a temporally coherent visual stimulus would enhance the representation of changes in timbre in the responses of auditory cortical neurons.
To isolate neural responses to the timbre change from those elicited by the on-going amplitude modulation, we extracted the 200ms epochs of the neuronal response during which the timbre deviant occurred and compared these to epochs from responses to otherwise identical stimuli without deviants. We observed that the spiking activity of many units differed between deviant and no-deviant trials (e.g. Fig 8a) and so we used a pattern-classifier approach to estimate the presence/absence of a timbre deviant in a given response window. We first considered the influence of temporal coherence between auditory and visual stimuli on the representation of timbre deviants in the single stream condition (A1V1, A1V2 etc.). We found that a greater proportion of units detected at least one deviant when the auditory stream in which deviants occurred was temporally coherent with the visual stimulus relative to the temporally independent condition. This was true both for awake (Fig. 8b; Pearson chi-square statistic, χ2 = 322.617, p < 0.001) and anesthetised animals (Fig. 8e; χ2 = 288.731, p < 0.001). For units that discriminated at least one deviant, discrimination scores were significantly higher when accompanied by a temporally coherent visual stimulus (Fig.8c, awake dataset, pairwise t-test t300 = 3.599 p<0.001; Fig. 8f, anesthetised data t262 = 4.444 p<0.001).

a Example unit (from the awake dataset) showing the influence of visual temporal coherence on spiking responses to dual stream stimuli with or without deviants embedded. Shaded rectangles indicate the 200 ms window over which the timbre deviant occurred and over which analysis was conducted. b-d timbre deviant discrimination in the awake dataset. Two deviants were included in each auditory stream giving a possible maximum of 4per unit b, Histogram showing the number of deviants (out of 4) that could be discriminated from spiking responses c, Box plots showing the average timbre deviant discrimination scores in the single stream condition across different visual conditions (Coh: coherent, ind: independent). The boxes show the upper and lower quartile values, and the horizontal lines at their “waist” indicate the median. d, Discrimination scores for timbre deviant detection in dual stream stimuli. Discrimination scores are plotted according to the auditory stream in which the deviant occurred and the visual stream that accompanied the sound mixture. e-g show the same as b-d but for the anesthetised dataset.
Across the population of units, we performed a two-way repeated measures ANOVA on discrimination performance with visual condition (V1/V2) and the auditory stream in which the deviants occurred (A1/A2) as factors. We predicted that enhancement of the representation of timbre deviants in the temporally coherent auditory stream would be revealed as a significant interaction term. Significant interactions were seen in both the awake (Fig. 8d, F(1, 600) = 29.138, p<0.001) and anesthetised datasets (Fig. 8g, F(1, 524) = 16.652, p<0.001). We also observed significant main effects of auditory and visual conditions in awake (main effect of auditory stream, F(1, 600) = 4.565, p = 0.033; main effect of visual condition, F(1, 600) = 2.650, p = 0.010) but not anesthetised animals (main effect of auditory stream, F(1,524) = 0.004, p = 0.948; main effect of visual condition, F(1, 524) =1.355, p = 0.245). Thus we concluded a temporally coherent visual stimulus can enhance the representation of features (here auditory timbre) orthogonal to those that promote binding between auditory and visual streams. This finding is consistent with our model of cross-modal binding (Fig. 1a, c) and so these data fulfil our definition of binding.
Discussion
Here we provide mechanistic insight into how auditory and visual information could be bound together to form coherent perceptual objects. Visual stimuli elicit reliable changes in the phase of the local field potential in auditory cortex that result in an enhanced spiking representation of auditory information. These results are consistent with the binding of cross-modal information to form a multisensory object. When two sounds are presented together within an auditory scene, the representation of the stream that is temporally coherent with the visual stimulus is enhanced. Importantly, this enhancement is not restricted to the encoding of the amplitude changes that bind auditory and visual information but extends to the encoding of auditory timbre, a stimulus dimension orthogonal to the dimensions that link auditory and visual stimuli. Thus our results meet the requirements for a strict neural test of cross-modal binding that was laid out in Bizley et al.6. These data provide a physiological underpinning for the pattern of performance observed in human listeners performing an auditory selective attention task in which detection of a pertubation in a stimulus stream is enhanced or suppressed, when a visual stimulus is temporally coherent with the target or masker auditory stream respectively5. The electrophysiological data presented here suggest that the temporally coherent auditory stream would be represented more effectively, making the task easier when this stream was the target and making the task more challenging when it was the masker. Surprisingly, the effects of the visual stimulus on the representation of an auditory scene can be observed in anesthetised animals ruling out any top-down effect of attentional modulation.
Previous investigations of the impact of visual stimuli on auditory scene analysis have frequently used speech stimuli. In order to probe more general principles that might relate to both speech and non-speech processing we chose to employ non-speech stimuli, but utilized modulation rates that fell within the range of syllable rates in human speech 23. Previous work has demonstrated that a visual stimulus can enhance the neural representation of the speech envelope both in quiet and in noise 3,24,25. Being able to see a talker's mouth provides listeners with rhythm information and information about the amplitude of the speech waveform which may help listeners by cueing them to pay attention to the auditory envelope26 as well as information about the place of articulation that can disambiguate different consonants27. Visual speech information is hypothesised to be relayed in parallel to influence the processing of auditory speech: Our data support the idea that early integration of visual information occurs26,28–30 and is likely to reflect a general phenomenon whereby visual stimuli can cause phase-entrainment in the local field potential. Our data support the contention that such early integration is unlikely to be specific to speech. Indeed low-frequency entrainment to modulations in an on-going stimulus are observed in the human brain and have been shown to optimize listening performance for non-speech stimuli 31. In contrast, later integration is likely to underlie information about speech gestures that might be used to constrain lexical identity26.
Consistent with previous studies, our analysis of local field potential activity revealed that visual information reliably modulated the phase of oscillatory activity in auditory cortex independently of the modulation frequency of the stimulus8–11. Neuronal excitability varies with LFP phase32–35 and may be the physiological mechanism through which cross-sensory information is integrated. Our analysis allowed us to isolate changes in LFP phase that were directly attributable to the visual stimulus and identified reliable changes in the LFP phase irrespective of whether the visual stimulus was temporally coherent with the auditory stimulus. Such a finding is consistent with the idea that the LFP phase synchronization arises from fluctuating inputs to cortical networks14,21,36. Our finding that visual stimulation elicited reliable phase modulation in both awake and anesthetised animals suggests that bottom-up cross-modal integration interacts with selective attention, which also modulates phase information in auditory cortex20. While our data suggest that cross-modal binding can occur in the absence of attention, it is likely that the effects we observe in auditory cortex are the substrates on which selective attention acts to further boost the representation of cross-modal objects.
In the awake animal the impact of visual stimulation on LFP phase reliability was smaller than in the anesthetised animal and was restricted to a narrower range of frequencies, consistent with a dependence of oscillatory activity on behavioural state37–39. Since the neural correlates of multisensory binding are evident in the anesthetised animal, the specific increase in alpha phase reliability that occurred in awake animals in response to temporally coherent auditory-visual stimulus pairs (Fig. 4c & 7e) may indicate an attention-related signal triggered by temporal coherence between auditory and visual signals. Phase resetting or synchronisation of alpha phase has been associated both with enhanced functional connectivity38 and as a top-down predictive signal for upcoming visual information40. Disambiguating these possibilities would require simultaneous recordings in auditory and visual cortex and/or recording during the performance of a task designed to explicitly manipulate attention.
Temporal coherence between sound elements has been proposed as a fundamental organising principle for auditory cortex41, 42 and here we extend this principle to the formation of cross-modal constructs. Our data provide evidence that one role for the early integration of visual information into auditory cortex is to resolve competition between multiple sound sources within an auditory scene. While previous studies have demonstrated a role for visual information in conveying lip movement information to auditory cortex 3,8,9,20, here we suggest a more general phenomenon whereby visual temporal cues facilitate auditory scene analysis through the formation of cross-sensory objects. The origin of the visual inputs is an open question but both visual cortical and sub-cortical structures innervate tonotopic auditory cortex7, 43. Identifying which of these inputs is responsible for the physiological effects we observe requires experiments that manipulate defined neural circuits.
In summary, activity in auditory cortex was reliably affected by visual stimulation in a manner that enhanced the representation of temporally coherent auditory information. Enhancement of auditory information was observed for sounds presented alone or in a mixture and for sound features that were related to (amplitude) and orthogonal to (timbre) variation in visual input. Such processes provide mechanistic support for a coherence based model of cross-modal binding in object formation.
Author contributions
HA, RKM, AKCL, JKB Conception and design, HA, SMT, KCW, GPJ, JKB Acquisition of data, HA, JKB Analysis and interpretation of data, HA, SMT, RKM, AKCL, JKB Drafting or revising the article.
Online Methods
Animal preparation
The experiments were approved by the Committee on Animal Care and Ethical Review of University College London and The Royal Veterinary College, and performed under license from the UK Home Office and in accordance with the Animals Scientific Procedures Act 1986. Neural responses were recorded in a total of 11 awake pigmented adult female ferrets (Mustela putorius furo; 1-5 years old). Data from 9 of these animals was used for the main experiment (532 units), data from 8 other animals (6/9 and two additional ferrets, 89 units) was collected for additional control analysis (Figures 6e, supplemental figure 6). Animals were chronically implanted with recording electrodes and passively listening/watching stimuli while holding their head at a water spout and receiving continuous water reward. These animals were trained in various listening tasks for other studies. An additional 5 adult females were used to record responses under anaesthesia.
Full methods for recording under anesthesia can be found in Bizley et al., 44. Briefly, ferrets were anesthetized with medetomidine (Domitor; 0.022mg/kg/h; Pfizer, Sandwich, UK) and ketamine (Ketaset; 5mg/kg/h; Fort Dodge Animal Health, Southampton, UK). The animal was intubated and the left radial vein was cannulated in order to provide a continuous infusion (5 ml/h) of a mixture of medetomidine and ketamine in lactated ringers solution augmented with 5% glucose, atropine sulfate (0.06 mg/kg/h; C-Vet Veterinary Products) and dexamethasone (0.5 mg/kg/h, Dexadreson; Intervet, UK). The ferret was placed in a stereotaxic frame in order to implant a bar on the skull, enabling the subsequent removal of the stereotaxic frame. The left temporal muscle was largely removed, and the suprasylvian and pseudosylvian sulci were exposed by a craniotomy, revealing auditory cortex (Kelly et al., 1986). The dura was removed over auditory cortex and the brain protected with 3% agar solution. The eyes were protected with zero-refractive power contact lenses. The animal was then transferred to a small table in a sound-attenuating chamber. Body temperature, end-tidal CO2, and the electrocardiogram were monitored throughout the experiment. Experiments typically lasted between 36 and 56 h. Neural activity was recorded with multisite silicon electrodes (Neuronexus Technologies) in a 1× 16, 2× 16 or 4× 8 (shank x number of sites) configuration.
Full surgical methods for recording implanting electrode arrays to facilitate recording from awake animals are available in Bizley et al. 45. Briefly, animals were bilaterally implanted with WARP-16 drives (Neuralynx, Montana, USA) loaded with high impedance tungsten electrodes (FHC, Bowdoin, USA) under general anaesthesia (medetomidine and ketamine induction, as above, isoflurane maintenance 1-3%). Craniotomies were made over left and right auditory cortex, a small number of screws were inserted into the skull for anchoring and grounding the arrays, and the WARP-16 drive was anchored with dental acrylic and protected with a capped well. Animals were allowed to recover for a week before the electrodes were advanced into auditory cortex. Pre-operative, peri-operative and post-operative analgesia were provided to animals under veterinary advice.
Stimulus presentation
All stimuli were created using TDT System 3 hardware (Tucker-Davis Technologies, Alachua, FL) and controlled via MATLAB (Mathworks, USA). For recordings in awake animals, sounds were presented over two loud speakers (Visaton FRS 8). Water deprived ferrets were placed in a dimly lit testing box (69 × 42 × 52 cm length × width × height) and received water from a central reward spout located between the two speakers. Sound levels were calibrated using a Brüel and Kjær (Norcross, GA) sound level meter and free-field ½-inch microphone (4191). Auditory streams were presented at 65 dB SPL (Fig. 1a). Visual stimuli were delivered by illuminating the spout with a white LED which provided full field illumination (Precision Gold N76CC Luxmeter, 0 to 36.9 lux). The animals were not required to do anything other than maintain their heads in position at the spout where they were freely rewarded. Recording was terminated when animals were sated.
For anesthetised recordings, acoustic stimuli were presented using Panasonic headphones (Panasonic RP-HV297, Bracknell, UK) at 65 dB SPL. Visual stimuli were presented with a white Light Emitting Diode (LED) which was placed in a diffuser at a distance of roughly 10 cm from the contralateral eye so that it illuminated virtually the whole contralateral visual field.
Stimuli and data acquisition
Auditory stimuli were artificial vowel sounds that were created in Matlab (MathWorks, USA). In the behavioural experiment that motivated this study 5,stimuli were 14 seconds in duration. However, we adapted the stimulus duration in awake recordings to 3 seconds in order to collect sufficient repetitions of all stimuli, and to ensure animals maintained their head position facing forwards for the whole trial duration. In the anesthetised recording stimulus streams were 14 seconds long, as in the human psychophysics 5 but we only analysed the first 3 seconds to ensure datasets were directly comparable (Supplemental Figure 7).
Stimulus A1 was the vowel [u] (formant frequencies F1-4: 460, 1105, 2857, 4205 Hz, F0= 195Hz), A2 was [a] (F1-4: 936, 1551, 2975, 4263 Hz, F0= 175Hz). Streams were amplitude modulated with a noisy lowpass (7 Hz cutoff) envelope. Unless specifically noted, the timbre of the auditory stream remained fixed throughout the trial. However, we also recorded responses to auditory streams that included brief timbre deviants. As in our previous behavioural study, deviants were 200ms epochs in which the identity of the vowel was varied by smoothly changing the first and second formant frequencies to and from those identifying another vowel. Stream A1 was morphed to/from [ε] (730, 2058, 2857, 4205 Hz) and A2 to/from [i] (437, 2761, 2975, 4263 Hz).
Visual stimuli were generated using an LED whose luminance was modulated with dynamics that matched the amplitude modulation applied to A1 or A2. In single stream conditions a single auditory and single visual stream were presented (e.g. A1V1, A1V2, A2V1, or A2V2) whereas in dual stream conditions both auditory streams were presented simultaneously, accompanied by a single visual stimulus (A12V1, A12V2, A12V1 A12V2) (Fig. 1e). Auditory streams were always presented from both speakers so that spatial cues could not facilitate segregation, and stimulus order was varied pseud-orandomly. In the anesthetised recordings each stimulus was presented 20 times. In the awake dataset, where recording duration was determined by how long the ferret remained at the central location (mean repetitions: 20, minimum: 14, maximum: 34).
During anaesthetised recordings, pure tone stimuli (150 Hz to 19 kHz in 1/3-octave steps, from 10 to 80 dB SPL in 10 dB, 100 ms in duration, 5 ms cosine ramped) were also presented. These allowed us to characterize individual units and determine tonotopic gradients, so as to confirm the cortical field in which any given recording was made. Additionally broadband noise bursts and diffuse light flashes (100 ms duration, 70 dB SPL) were presented and used to classify a stimulus as auditory, visual or auditory visual. LFPs were subjected to current source density analysis to identify sources and sinks as described by Kaur et al. 46
Data Analysis
Electrophysiological data were analysed offline. Spiking activity and local field potential signals were extracted from the broadband voltage waveform by filtering at 0.3-5kHz and 1-150 Hz respectively. Spikes were detected, extracted and then sorted with a spike-sorting algorithm (WaveClus) (Quiroga et al., 2004).
We used a Euclidean distance based pattern classifier (Schnupp et al., 2006) with leave-one-out cross validation to determine whether the neuronal responses to different stimuli could be discriminated. Spiking responses to a given stimulus were binned into a series of spike counts from stimulus onset (0 s) to offset (3s) in 20 ms bins. The average across-repetition response to each stimulus (excluding the to-be-classified response) were used as templates and the response to a single stimulus presentation was classified by calculating the Euclidean distance between itself and the template sweeps and assigning it to the closest template. To determine whether the classifier performed significantly better than expected by chance, a 1000 iteration permutation test was performed where trials were drawn (with replacement) from the observed data and randomly assigned to a stimulus that was then used for template formation / decoding. A neural response was considered to be significantly informative about stimulus identity if the observed value exceeded the 95th percentile of the randomly-drawn distribution.
This approach allowed us to classify units according to their functional properties: auditory units discriminated two auditory stimuli based on the amplitude modulation of sound (A1 versus A2) regardless of visual dynamics, (Fig. 2a, b), visual units discriminated visual presentations based on temporal envelope of visual stimuli (V1 versus V2) regardless of auditory presentation (Fig. 2c, d) and AV units could do both. This approach was extended to classify dual stream responses by using the average response to each of the temporally coherent single stream stimuli (A1V1 or A2V2) as templates. Performance was (arbitrarily) expressed as the proportion of responses classified as being from the A1, and compared for the two dual stream stimuli with different visual conditions (Figure 5). To be considered in this analysis the response of a unit had to be informative about the single stream stimuli (i.e. classified as either auditory and/or visual discriminating).
Phase/power dissimilarity analysis
Local field potential recordings were considered for all sites at which there was a significant driven spiking response, irrespective of whether that response could discriminate auditory or visual stream identity. For the single stream trials, we computed a single Stream Phase Dissimilarity Index (PDI), which characterizes the consistency and uniqueness of the temporal phase/power pattern of neural responses to continuous auditory stimuli (Luo and Poeppel, 2007). This analysis compares the phase (or power) consistency across repetitions of the same stimulus with a baseline of phase-consistency across trials in which different stimuli were presented.
In the first stage of PDI analysis, we obtained a time-frequency representation of each response using wavelet decomposition with complex 7-cycle Morlet wavelets in 0.5 steps between 2.5–45 Hz, resulting in 86 frequency points. Next, we calculated the inter-trial phase-coherence value (ITPC; Equ.1) at each time-frequency point, across all trials in which the same stimulus was presented. For each frequency band, the ITPC time-course was averaged over the duration of the analysis window and across all repetitions to obtain the average within-stimulus ITPC.

In which N is equal to the number of trials, and θ is the phase of trial k at a given frequency (f) and time (t). The across-stimuli ITPC was estimated using the same approach but using shuffled data, such that the ITPC was computed across trials with the same auditory stimulus but randomly drawn visual stimuli. The single stream phase dissimilarity index (Single stream PDI) was computed as the difference between the ITPC value calculated for within trials and the ITPC values calculated across visual trials (Equ.2). y. The dissimilarity function for each frequency bin i was defined as;

Large positive PDI indicate that responses to individual stimuli have a highly consistent response on single trials. Single stream PDI values were calculated for each stimulus type and then averaged across stimuli to calculate values for temporally coherent and temporally independent auditory visual stimuli. Single stream PDI was positive if within stimulus ITPC was larger than across-stimulus ITPC (pairwise t-test, p<0.05 Bonferroni correction for 86 frequencies points) and was considered significant if a minimum of 2 adjacent bins exceeded the corrected threshold.
Dual stream phase dissimilarity index (dual stream PDI) values were calculated by extending this approach for dual stream stimuli with the goal of determining how the temporal envelope of the visual stimulus influences the neural response to a sound mixture. To this end, we calculated the within-dual ITPC from the A12V1 trials and A12V2 trials separately and across-dual ITPC by randomly selecting trials from both stimuli (Equ.3). The within-dual and across-dual ITPCs were then averaged over time and subtracted to yield the dual stream PDI (Equ.3).

Positive dual stream PDI values indicate that the time course of the neural responses was influenced by visual input, despite the identical acoustic input. We determined whether the dual stream PDI was greater if the within_dual ITPC was significantly larger than across_dual ITPC (pairwise t-test, p<0.05 Bonferroni correction, as above).
Timbre deviant analysis
In order to determine how a visual stimulus influenced the ability to decode timbre deviants embedded within the auditory streams we used the cross-validated pattern classifier described above for analysing single stream stimuli to discriminate deviant from no-deviant trials. Responses were considered over the 200 ms time window that the deviant occurred (or the equivalent point in the no-deviant stimulus) binned with a 10 ms resolution. Significance was assessed by a 1000 iteration permutation test in which trials were randomly drawn with replacement from deviant and no-deviant responses. The discrimination score was calculated as the proportion of correctly classified trials.
Acknowledgments
This work was funded by grants to each author: JKB: Wellcome Trust / Royal Society WT098418MA; Biotechnology and Biological Sciences Research Council (BB/H016813/1), and an Action on Hearing Loss Studentship (596: UEI: JB); RKM: NIH K99DC014288 and Hearing Health Foundation Emerging Research Grant; AKCL: NIH R01DC013260; and an International Exchanges Scheme award from the Royal Society to JKB and AKCL.
References


