

Abstract
Extracting functional information from sequencing data is a main question of computational cancer genomics. We present a computational pipeline to characterize how cancers from different tissue types might have acquired canonical cancer hallmarks via preferential genomic alteration of different biological pathways. This is based on SLAPEnrich, a statistical method implemented in an open source R package, to identify pathway-level enrichments of genetic alterations. We used SLAPEnrich and a curated collection of 374 orthogonal pathway gene-sets encompassing 3,915 genes from public resources mapped to 10 canonical cancer hallmarks to characterise the landscape of pathway alterations contributing to the acquisition of different cancer hallmarks in 4,415 patients across 10 cancer types, from The Cancer Genome Atlas. We find that the heterogeneity of the significantly genomically altered pathways within certain hallmarks reflects their established predominance in determined cancer types and their clinical relevance.
In addition, although most of the pathway alteration enrichments and hallmark heterogeneities are guided by somatic mutations in established cancer driver genes, when excluding these variants from the analyses, the levels of predominance of the considered hallmarks are strikingly preserved across cancer types. Therefore we propose to use the obtained hallmark heterogeneity signatures as a ground truth to characterise long tails of infrequent genomic alterations across cancer types, and we highlight a number of potential novel cancer driver genes and networks.
Background
The swift progression of next-generation sequencing technologies is enabling a fast and affordable production of an extraordinary amount of genome sequences. Cancer research is particularly benefiting from these advances, and comprehensive catalogues of somatic mutations involved in carcinogenesis, tumour progression and response to therapy are becoming increasingly available and ready to be exploited for the identification of new diagnostic, prognostic and therapeutic markers [1, 2, 3, 4].
Exploration of the genomic makeup of multiple cancer types has highlighted that driver somatic mutations typically involve few genes altered at high frequency and a long tail of more genes mutated at very low frequency [5, 6], with a tendency for both sets of genes to code for proteins involved into a limited number of biological processes [7]. As a consequence, a reasonable approach is to consider these alterations by grouping them based on prior knowledge of the cellular mechanisms and biological pathways where the products of the mutated genes operate [8]. This reduces the dimensionality of large genomic datasets involving thousands of altered genes into a sensibly smaller set of altered mechanisms that are more interpretable, and possibly actionable in a pharmacological or experimental way [9]. Additionally, thanks to the increased function interpretability, this grouping facilitates the identification of the possible alterations underpinning an evolutionary successful trait acquired by a normal cell as it transforms itself in a pretumoral one and ultimately into cancer. These traits have been summarised into a set of 11 principles, collectively referred as the hallmarks of cancer [10, 11].
Here we present a computational strategy, relying on the novel statistical tool SLAPEnrich, to characterise the set of genomically altered pathways contributing to the acquisition of the canonical cancer hallmarks and to quantify the predominance of each hallmark in each cancer type. We show results from applying this strategy to 10 different cancer types, via a systematic analysis of 4,415 publicly available cancer patients’ genomes (from the Cancer Genome Atlas). After verifying that the majority of the cancer hallmark predominances are led by somatic mutations in established high-confidence cancer genes, we show that they are maintained when excluding these variants from the analysis. Thus we propose to use the obtained heterogeneity signatures of cancer hallmarks as the ground truth for functionally characterising long tails of infrequent genomic alterations, across cancer types. Finally we highlight a number of potential novel cancer driver genes and networks, identified with the proposed approach.
Results
Sample Level Analysis of Pathway Alterations Enrichments (SLAPenrich)
In the first step of our implemented computational pipeline we make use of SLAPenrich (Sample Level Analysis of Pathway alteration Enrichments): a computational method implemented into an R package to perform pathway analyses of genomic datasets at the sample-population level. We have designed this tool on purpose as a mean to characterize in an easily interpretable way sparse somatic mutations detected in heterogeneous cancer sample populations, which share traits of interest and are subjected to strong selective pressure, leading to combinatorial patterns.
Several computational methods have been designed to perform pathway analysis on genomic data, aiming at prioritizing sets of genomically altered genes whose products operate in the same cellular process or functional network. All the approaches proposed so far toward this aim can be classified into two main classes [8].
The first class of approaches aims at identifying pathways whose composing genes are significantly over-represented in the set of altered genes across all the samples of a dataset compared against the background set of all studied genes. Generally, a Fisher’s exact test is used to calculate the statistical significance of this over-representation. Many tools exist and are routinely used to perform this analysis [12, 13, 14], sometimes incorporating additional features, such as accounting for inter-gene dependencies and signal correlations [15].
To identify pathways, or any other gene sets, that are over-represented in a selected set of genes satisfying a certain property (for example, being differentially expressed), the likelihood of their recurrence in the gene set of interests is usually estimated. This is quantified through a p-value assignment computed through a hypergeometric (or Fisher exact) test, against the null hypothesis that there is no association between the pathway under consideration and the biological state yielding the selected set of genes. The test fail (producing a non significant p-value) when the overlap between the considered pathway and the set of genes of interests is close to that expected by random chance.
The problem we tackle with SLAPenrich is rather different: we want to test the hypothesis that, in a given cohort of cancer patients, the number of samples harbouring a mutation in at least one gene belonging to a given pathway is significantly larger and divergent from its expectation, considering the size of the cohort, the background mutation rates of the individual samples and the (non-overlapping) total exonic block lengths of the genes. As a consequence, the first step is to model the probability of observing at least a mutation in a single gene belonging to the pathway under consideration across the individual samples. The second step is to aggregate these individual probabilities in a collective test against the null hypothesis that there is no association between the pathway under consideration and the genomic alterations observed in the analysed cohort. To our knowledge there are only two other publicly available tools to conduct this type of analyses: PathScan [16] and PathScore [17]. While they share commonalities with SLAPEn-rich, several aspects make these two tools unsuitable for the analysis described in this manuscript (Supplementary Methods).
The second class of approaches aims at identifying novel pathways by mapping alteration patterns on large protein networks. The combinatorial properties occurring among the alterations are then analyzed and used to define cost functions, for example based on the tendency of a group of genes to be mutated in a mutual exclusive manner. On the basis of these cost functions, optimal sub-networks are identified and interpreted as novel cancer driver pathways [18, 19, 20].
However, at the moment there is no consensual way to rigorously define a mathematical metric for mutual exclusivity and compute its statistical significance, and a number of interpretations exist [18, 19, 21, 22, 23].
SLAPenrich does not require somatic mutations in a pathway to be statistically enriched among those detected in each sample nor the merged (or aggregated) set of mutations in the population. Relying on the mutual exclusivity principle [24], SLAPenrich assumes that a single mutation in a gene can be enough to deregulate the activity of the pathway, providing selective growth advantages. Hence, SLAPenrich belongs roughly to the first category described above, although it shares the mutual exclusivity consideration with the methods in the second.
More precisely, after modeling the probability of a genomic alteration in at least one member of a given pathway across the individual samples, a collective statistical test is performed against the null hypothesis that the number of samples with at least one alteration in that pathway is close to that expected by random chance, therefore no association exists between the analyzed population and the pathway under consideration. An additional advantage of modeling probabilities of at least an individual mutation in a given pathway (instead of, for example, the probability of the actual number of mutated genes) is that this prevent signal saturations due to hypermutated samples.
The input to SLAPenrich is a collection of samples accounting for the mutational status of a set of genes, such as a cohort of human cancer genomes. This is modeled as a dataset where each sample consists of a somatic mutation profile indicating the status (point-mutated or wild-type) of a list of genes (Figure 1A). For a given biological pathway P, each sample is considered as an individual Bernoulli trial that is successful when that sample harbors somatic mutations in at least one of the genes belonging to the pathway under consideration (Figure 1B).

(A) The probability pi of a pathway P being genomically altered in the individual sample si of the analyzed dataset is computed. This accounts for the somatic mutation rate of the sample and the sum of the total exonic length blocks of all the k genes in the pathway under consideration. Xi is a random variable quantifying the number of genes belonging to P that are altered in si, and hence the probability of P being altered is pi = Pr(Xi ≥ 1) (B) A pathway P is assumed to be genomically altered in the sample si if at least one of its k genes is mutated in si. (C) The number of samples for which Xi is greater than 0 is modeled through a Poisson binomial distribution π. Here the success probabilities are the likelihoods computed in A. δ is the Dirac delta function, equal to 1 only when its argument is equal to 0. A p-value against the null hypothesis that there is no association between P and the genomic somatic alterations in the analyzed dataset is computed as the complementary cumulative distribution function of π evaluated at O(P), which is the observed number of samples where P is genomically altered.
The probability of success of each of these trials (i. e. observing a pathway with at least one mutation) is computed by either (i) a general hypergeometric model accounting for the mutation burden of the sample under consideration, the size of the gene background population and the number of genes in the pathway under consideration, or (ii) a more refined modeling of the likelihood of observing point mutations in a given pathway, accounting for the total exonic block lengths of the genes in that pathway (Figure 1AB) and the estimated (or actual) mutation rate of the sample under consideration [25]. In addition, more sophisticated methods, accounting for example for gene sequence compositions, trinucleotide rates, and other covariates (such as expression, chromatin state, etc) can be used through user-defined functions that can be easily integrated in SLAPenrich.
Once these probabilities have been computed, the expected number of samples in the population harboring at least one somatic mutation in P can be estimated, and its probability distribution modeled analytically. Based on this, a pathway alteration score can be computed observing the deviance of the number of samples harboring somatic mutations in P from its expectation, and its statistical significance quantified analytically (Figure 1C). Finally, the resulting statistically enriched pathways can be further filtered by looking at the tendency of their composing genes to be mutated in a mutually exclusive fashion across all the analyzed samples, as an additional evidence of positive selection [26, 18, 19].
SLAPenrich includes a visualization/report framework allowing an easy exploration of the outputted enriched pathways across the analyzed samples, in a way that highlights their mutual exclusivity mutation trends, and a module for the identification of corecomponents genes, shared by related enriched pathways.
A formal description of the statistical framework underlying SLAPenrich is provided in the Methods; further details, results from a case study obtained applying SLAPenrich on a large lung adenocarcinoma genomic dataset, and a comparison with other similar tools are detailed in the Supplementary Methods, Supplementare Tables S1, S2, S3, S4 and S5, and Supplementary Figures S1, S2, and S3.
As detailed below, SLAPenrich can be used to systematically analyze large cohorts of cancer genomes providing a data-driven exploration of mutated pathways that can be easily compared across cancer types. Additionally, the format of the results allows a wide range of novel investigations at a high level of abstraction.
Mutational burdens at the pathway and gene level are not correlated
We performed SLAPenrich analyses of 10 different genomic datasets containing somatic point mutations, preprocessed as described in [27], from 4,415 patients across 10 different cancer types (results in Additional File 5). These dataset come from publicly available studies, in particular The Cancer Genome Atlas (TCGA) and the International Cancer Genome Consortium (ICGC). These samples (see Methods) comprise breast invasive carcinoma (BRCA, 1,132 samples), colon and rectum adenocarcinoma (COREAD, 489), glioblastoma multiforme (GBM, 365), head and neck squamous cell carcinoma (HNSC, 375), kidney renal clear cell carcinoma (KIRC, 417), lung adenocarcinoma (LUAD, 388), ovarian serous cystadenocar-cinoma (OV, 316), prostate adenocarcinoma (PRAD, 242), skin cutaneous melanoma (SKCM, 369), and thyroid carcinoma (THCA, 322).
We observed a weak correlation (R = 0.53, p = 0.11) between the number of enriched pathways across the different analyses and the number of available samples in the analysed dataset (Supplementary Figure S4A), but a down-sampled analysis showed that our results are not broadly confounded by the sample sizes (see Methods and Supplementary Figure S4B).
We investigated how our pathway enrichments capture known tissue specific cancer driver genes. To this aim, we used a list of high-confidence and tissue-specific cancer driver genes [27, 28] (from now high-confidence Cancer Genes, HCGs, assembled as described in the Methods). We observed that the majority of the HCGs was contained in at least one SLAPenriched pathway, across the 10 different tissues analyses (median percentage = 63.5, range = 88.5%, for BRCA, to 28.7% for SKCM) (Supplementary Figure S4C).
Interestingly, we found that the number of SLAPen-riched pathways per cancer type (median = 130, range = 55 for PRAD, to 200 for BRCA and COREAD) was independent from the average number of mutated genes per sample across cancer types (median = 46, range from 15 for THCA to 388 for SKCM) with a Pearson correlation R = 0.16 (p = 0.65), Figure 2A, as well as from the number of high confidence cancer driver genes (as predicted in [28], median = 100, range from 33 for THCA to 251 for SKCM, Figure 2B). Particularly, THCA has the lowest average number of mutations per sample (15.03), but there are 4 tissues with a lower number of pathways mutated. In contrast, SKCM has the highest average number of point mutations per sample (387.63), but the number of affected pathways is less than half of those of BRCA and GBM (82 enrichments against an average of 191), which have on average less than 100 mutations per sample (Figure 2). GBM, OV, KIRC, PRAD and BRCA are relatively homogeneous with respect to the average number of somatic mutations per sample (mean = 41.03, from 34.76 for KIRC to 45.95 for PRAD) but when looking at the number of enriched pathways for this set of cancer types we can clearly distinguish two separate groups (Figure 2). The first group includes BRCA and GBM that seem to have a more heterogeneous sets of processes impacted by somatic mutations (average number of SLAPenriched pathways = 191) with respect to the second group (63 SLAPenriched pathways on average). These results suggest that there is a large heterogeneity in the number of processes deregulated in different cancer types that is independent of the mutational burden. This might be also indicative of different subtypes with dependencies on different pathways (and at least for BRCA this is expected) but could be also biased by the composition of the analysed cohorts being representative of a selected subtypes only.
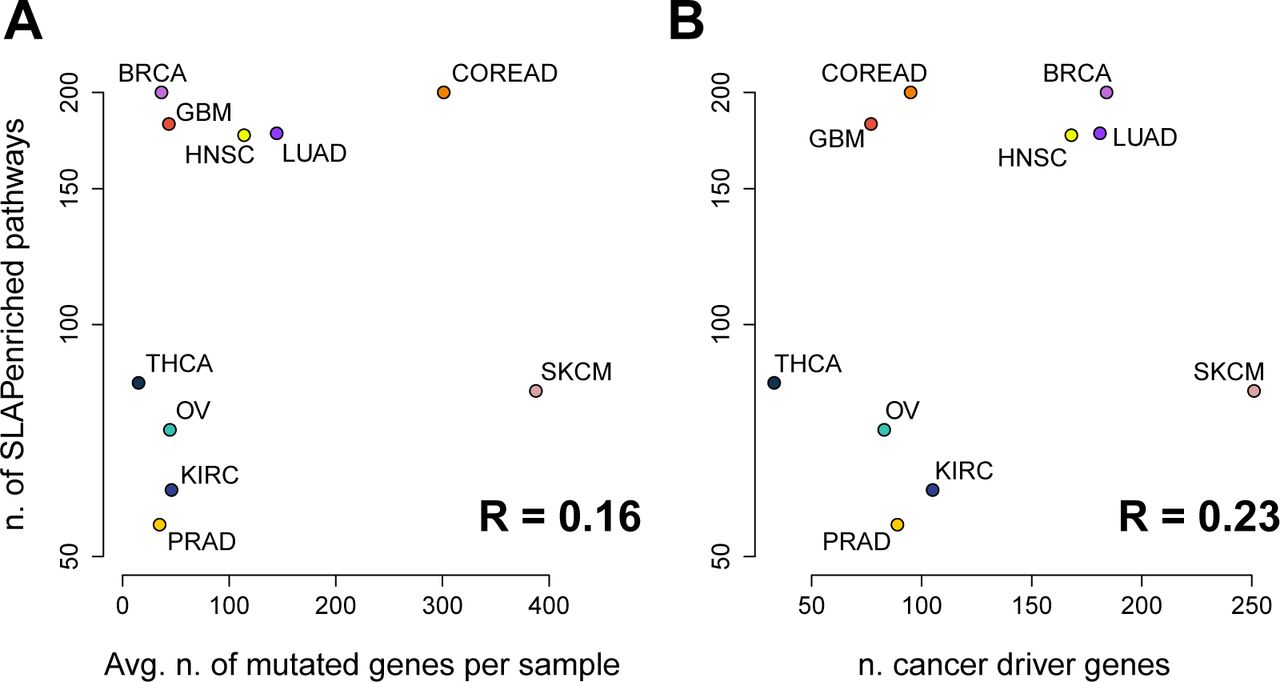
Number of pathway enriched at the population level across cancer types compared with the average number of mutated genes (A) and the average number of high confidence cancer driver genes (B).
SLAPenrich analyses across different cancer types highlights the heterogeneity of cancer hallmark acquisition
Subsequently, we reasoned that since the main role of cancer driver alterations is to enable cells to achieve a series of phenotypic traits called the ‘cancer hallmarks’ [10, 11], that can be linked to gene mutations [29], it would be informative to group the pathways according to the hallmark they are associated with. Towards this end, through a computer aided manual curation (see Methods and Supplementary Table S6) we were able to map 374 pathways to 10 cancer hallmarks [10, 11] (Figure 3AB), for a total number of 3,915 genes (included in at least one gene set associated to at least one hallmark; Supplementary Table 7). The vast majority (99%, 369 sets) of the considered pathway gene-sets were mapped on two hallmarks at most, and 298 of them (80%) was mapped onto one single hallmark (Figure 3C). Regarding the individual genes contained in at least one pathway gene-set, about half (49%) were associated with a single hallmark, 22% with two, 12% with three, and 7% with four(Figure 3D). Finally, as shown in Figure 3E, the overlaps between the considered pathway gene-sets was minimal (74% of all the possible pair-wise Jaccard indexes was equal to 0 and 99% < 0.2). In summary, our manual curation produced a non-redundant matching in terms of both pathways- and genes-hallmarks associations.

(A) Heatmap with cancer hallmarks on the rows, pathways gene sets on the columns. A coloured bar in position (i,j) indicates that the j-th pathway is associated with the i-th hallmark; bar diagram on the right shows the number of pathways associated with each hallmark. (B) Heatmap with cancer hallmarks on the rows and genes on the columns. A coloured bar in position (i, j) indicates that the j-th gene is contained in at least one pathway associated with the i-th hallmark (thus associated with the i-th hallmark); bar diagram on the right shows the number of genes associated with each hallmark. (C) Number of associated hallmarks per pathways: the majority of the pathways is associated with 1 hallmark. (D) Number of associated hallmarks per gene: the majority of the genes is associated with less than 3 hallmarks. (E) Distribution of Jaccard similarity scores (quantifying the extent of pair-wise overlaps) computed between pairs of pathway gene sets.
Mapping pathway enrichments into canonical cancer hallmarks through this curation allowed us to explore how different cancer types might acquire the same hallmark by selectively altering different pathways (Figure 4, and Supplementary Figure S5). Heatmaps in these figures (one per each hallmark) show different level of enrichments of pathways associated to the same hallmark across different tissues.

Heatmaps showing pathways enrichments at the population level across cancer types for individual hallmarks (representative cases). Color intensities correspond to the enrichment significance. Cancer types and pathways are clustered using a correlation metric. See also additional figure 4.
We investigated at what extent the identified hallmark-associated enriched pathways were dominated by somatic mutations in the high-confidence cancer genes (HCGs) [28], across cancer types. This analysis also highlights the ratio of these pathways with variant enrichments in potentially novel cancer driver genes and networks. To this aim, for each pathway P enriched in a given cancer type T, we computed an HCG-dominance score as the ratio between the number of T samples with mutations in HCGs belonging to P and the total number of T samples with mutations in any of the gene belonging to P. Results of this analysis are shown in Supplementary Figures S6 and S7. We observed a median of 15% of pathway enrichments, across hallmarks, with an HCG-dominance score < 50%, thus potentially not led by somatic mutations in HCGs (range from 9% for Deregulating Cellular Energetics to 21% for Genome Instability and Mutation). Additionally, a median of 3% of pathway enrichments had a null HCG-dominance, thus not involved somatic mutations in HCGs (range from 0.25% for Evading Growth Suppression to 15% for Avoiding Immune Destruction). Across all the hallmarks, the cancer type with the lowest median HCG-dominance was KIRC (33%), whereas that with the highest was THCA (91%).
Patterns and well defined clusters can be clearly distinguished in the heatmaps of Figure 4. As an example, the heatmap related to the Genome Instability and mutation hallmark shows that BRCA, OV, GBM, LUAD and HNSC might achieve this hallmark by selectively altering a group of pathways related to homologous recombination deficiency, whose prevalence in BRCA and OV is established [30]. This deficiency has been therapeutically exploited recently and translated into a clinical success thanks to the introduction of PARP inhibition as a very selective therapeutic option for these two cancer types [31].
Pathways preferentially altered in BRCA, OV, GBM, LUAD and HNSC include G2/M DNA Damage Checkpoint // Processing Of DNA Double Strand Break Ends, TP53 Regulates Transcription Of DNA Repair Genes, and other signaling networks related to BRCA1/2 and its associated RING Domain 1 (BARD1). Conversely, the Androgen receptor pathway, known to regulate the growth of glioblastoma multiforme (GBM) in men [32] is also exclusively and preferentially altered in this cancer type.
The acquisition of the Genome Instability and mutation hallmark seems to be dominated in COREAD by alterations in the HDR Through Single Strand Annealing (SSA), Resolution Of D Loop Structures Through Synthesis Dependent Strand Annealing (SDSA), Homologous DNA Pairing And Strand Exchange and other pathways more specifically linked to a microsatellite instability led hypermutator phenotype, known to be prevalent in this cancer type [33].
Finally, the heatmap for Genome Instability and Mutation shows nearly no enriched pathways for SKCM. This is consistent with the high burden of mutations observed in melanoma originating from cell extrinsic processes such as UV light exposure [34]. The maintenance of genomic integrity is guarded by a network of damage sensors, signal transducers, and mediators, and it is regulated through changes in gene expression. Recent studies show that miRNAs play a crucial role in the response to UV radiation in skin cells [35]. Our analysis strikingly detects MiRNAs Involved In DNA Damage Response as the unique pathway associated to Genome instability and mutation enriched in SKCM. This suggests that mutations in this pathway, involving ATM (as top frequently mutated gene, and known to induce miRNA biogenesis following DNA damage [36]), impair the ability of melanocytes to properly respond to insult from UV light and may have a significant role in the tumourigenesis of melanoma.
The Avoiding Immune destruction heatmap (Figure 4) highlights a large number of pathways selectively enriched in COREAD, whereas very few pathways associated to this hallmark are enriched in the other analysed cancer types. This could explain why immunotherapies, such as PD-1 inhibition, have a relatively low response rate in COREAD when compared to, for example, non-small cell lung cancer [37], melanoma [38] or renal-cell carcinoma [39]. In fact, response to PD-1 inhibition in COREAD is limited to tumours with mismatch-repair deficiency, perhaps due to their high rate of neoantigen creation [40].
In the context of COREAD, the Tumor-promoting inflammation heatmap (Figure 4) also highlights several pathways predominantly and very specifically altered in this cancer type. Chronic inflammation is a proven risk factor for COREAD and studies in animal models have shown a dependency between inflammation, tumor progression and chemotherapy resistance [41]. Indeed, a number of clinical trials evaluating the utility of inflammatory and cytokine-modulatory therapies are currently underway in colorectal cancer [42, 43]. Interestingly, according to our analysis this hallmark is acquired by SKCM by exclusively preferentially altering IRF3 related pathways.
Several other examples would be worthy of mention. For example, the detection of the Warburg effect pathway contributing to the acquisition of the Deregulating cellular energetics hallmark in GBM only (Figure 4). The Warburg effect is a unique bioenergetic state of aerobic glycolysis, whose reversion has been recently proposed as an effective way to decrease GBM cell proliferation [44]. Additionally, the pathway Formation of senescence associated heterochromatin, associated to the Enabling replicative immortality hallmark is enriched in multiple cancer types. Genomic alterations in this pathway have not been linked to cancer so far. More interestingly the enrichment of this pathway, across cancer types, is not driven by any established cancer gene.
Finally, we quantified the diversity of pathways used to achieve each hallmark in a given cancer type, via a cumulative heterogeneity score (CHS) computed as the proportion of the pathways associated to that hallmark that are enriched. The larger this score the larger the number of different pathways a given cancer type alters in order to achieve the considered hallmark. A larger heterogeneity of pathways, in turn, could point to the exploitment of more evolutionary trajectories (reflected by selecting genomic alterations in a larger number of associated pathways). If this holds true, the larger this score the more the evolutionary fitness of a cancer type may depend on acquiring the hallmark under consideration.
Joining the CHSs of all the hallmarks resulting from the analysis of a given cancer type, gives its hallmark heterogeneity signature (Figure 5). Results show consistency with the established predominance of certain hallmarks in determined cancer types, such as for example a high CHS for Genome instability and mutation in BRCA and OV [45], for Tumour-promoting inflammation and Avoiding immune-destruction in COREAD [46]. Lastly, and as expected for Sustaining proliferative-signaling and Enabling replicative immortality, the key hallmarks in cancer initiation [10], high CHSs are observed across the majority of the analysed cancer types.
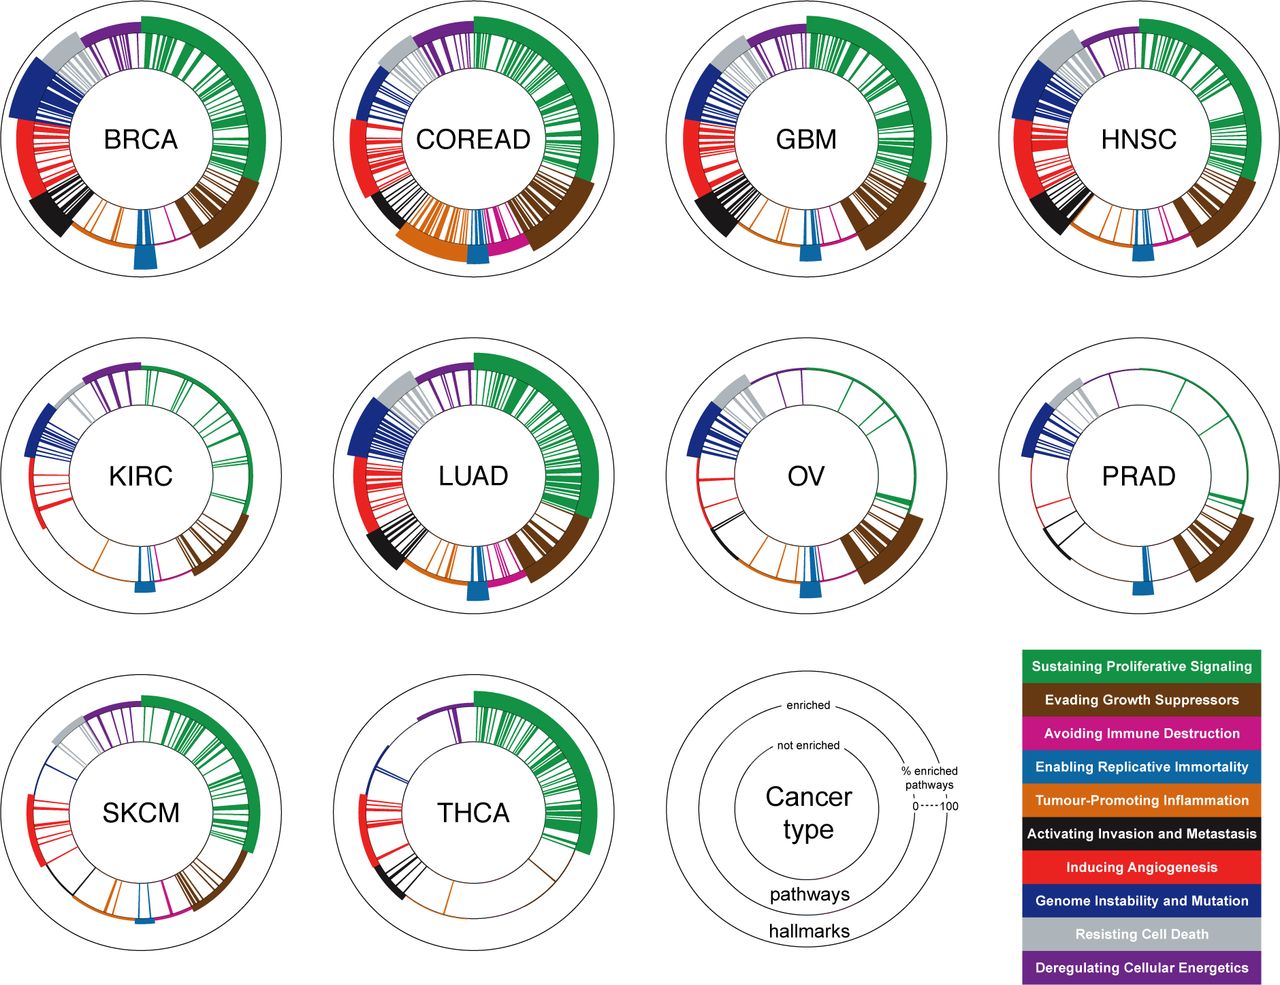
Each cancer hallmark signature plot is composed of three concentric circles. Bars between the inner and middle circles indicate pathways, bars between the middle and external circle indicate cancer hallmarks. Different colors indicate different cancer hallmarks. Pathway bars are coloured based on their hallmark association. The presence of a pathway bar indicates that the corresponding pathway is enriched at the population level (FDR < 5%, EC = 50%) in the cancer type under consideration. The thickness of the hallmark bars are proportional to the ratio between the enriched and total associated pathways.
Taken together, these results show the potential of SLAPenrich to perform systematic landscape analyses of large cohorts of cancer genomes. In this case it allowed us to highlight commonalities and differences in the acquisition of the cancer hallmarks across tissue types, confirming several known relations between cancer types, and pinpointing preferentially altered pathways and hallmark acquisitions.
Hallmark heterogeneity analysis points at potential novel cancer driver genes and networks
To investigate the potential of SLAPenrich in identifying novel cancer driver genes and networks we performed a final analysis (from now the filtered analysis) after removing all the variants involving, for each considered cancer type, the corresponding High Confidence Genes (HCGs). Results of this exercise (Figure 6 and Supplementary Figure 8), showed that the majority of the enrichments identified in the original analyses (on the unfiltered genomic datasets) were actually led by alterations in the HCGs (consistent with their condition of high reliable cancer genes). The average ratio of retained enrichments in the filtered analyses across cancer types (maintained enrichments (MA) in Figure 6 and Supplementary Figure 8) was 21% (range from 2.1% for GBM to 56.2% for COREAD). However, several pathway enrichments (some of which did not include any HCGs) were still detected in the filtered analysis and, most importantly, the corresponding hallmark heterogeneity signatures were largely conserved between the filtered and unfiltered analyses for most of the cancer types, with coincident top fitting hallmarks and significantly high over-all correlations (Figure 6, Supplementary Figure 8). We assume that the hallmark signatures from the original unfiltered analyses provide a faithful representations of the mutational landscape of the analysed cancer types and their hallmark predominancies. Detecting the same hallmark predominancies, despite the removal of variants in HCGs (which are highly frequently mutated), indicates that the enrichment of hallmark-associated pathway in the filtered analysis is collectively led by mutations in novel and lowly frequently mutated cancer driver genes that are functionally interconnected (whole bulk of results in Additional File 7 and examples in Figure 7).

In each row, the first circle plot show pathway enrichments at the population level when considering all the somatic variants (bars on the external circle) and when considering only variants not involving known high-confidence cancer driver genes (internal circle); the second circle plot compares the hallmark signatures resulting from SLAPenrich analysis including (bars on the external circle) or excluding (bars on the internal circle) the variants involving known high-confidence cancer genes. The bar plot shows a comparison, in terms of true-positive-rate (TPR) and positive-predicted-value (PPV), of the SLAPenriched pathways recovered in the filtered analysis vs. the complete analysis., The scatter plots on the right show a comparison between the resulting hallmark signatures.

Picked examples of novel putative cancer driver genes and networks. The first FDR value refers to the unfiltered analysis, whereas the second FDR refers to the filtered one.
An example is represented by the pathway Activation Of Matrix Metalloproteinases associated with the Invasion and metastasis hallmark and highly enriched in the filtered analyses of COREAD (FDR = 0.002%), SKCM (0.09%) (Figure 7A), LUAD (0.93%), and HNSC (3.1%). The activation of the matrix metalloproteases is an essential event to enable the migration of malignant cells and metastasis in solid tumors [47]. Although this is a hallmark acquired late in the evolution of cancer, according to our analysis this pathway is still detectable as significantly enriched. As a consequence, looking at the somatic mutations of its composing genes (of which only Matrix Metallopeptidase 2 - MMP2 - has been reported as harboring cancer driving alterations in LUAD [28]) might reveal novel key components of this pathway leading to metastatic transitions. Interestingly, among these, one of the top frequently mutated genes (across all the 4 mentioned cancer types) is Plasminogen (PLG), whose role in the evolution of migratory and invasive cell phenotype is established [48]. Furthermore, blockade of PLG with monoclonal antibodies, DNA-based vaccination or silencing through small interfering RNAs has been recently proposed to counteract cancer invasion and metastasis [49]. The remaining altered component of this pathway is mostly made of a network of very lowly frequently mutated (and in a high mutual exclusive manner) other metalloproteinases.
Another similar example is given by the IL 6 Type Cytokine Receptor Ligand Interactions pathway significantly enriched in the filtered analysis of SKCM (FDR = 4.6%) and associated with the Tumour-promoting inflammation hallmark (Figure 7B). IL-6-type cytokines have been observed to modulate cell growth of several cell types, including melanoma [50]. Increased IL-6 blood levels in melanoma patients correlate with disease progression and lower response to chemotherapy [51]. Importantly, studies proposed OSMR, a IL-6-type of cytokine receptor, to play a role in the prevention of melanoma progression [52], and as a novel potential target in other cancer types [53]. Consistently with these findings, OSMR is the member of this pathway with the largest number of mutations in the SKCM cohort (Figure 7B), complemented by a large number of other lowly frequently mutated genes (most of which are interleukins).
In the context of melanoma, we observed other two pathways highly enriched in the filtered analysis: PDGF receptor signaling network (FDR = 2.7%) (Figure 7C) and Neurophilin Interactions with VEGF And VEGFR (0.21%)(Figure 7D), both associated with the Inducing angiogenesis hallmark. Mutations in all the components of these two pathways are not common in SKCM and have not been highlighted in any genomic study so far. The first of these two pathway enrichments is characterised by patterns of highly mutually exclusive somatic mutations in Platelet-derived growth factor (PDGF) genes, and corresponding receptors: a network that has been recently proposed as an autocrine endogenous mechanism involved in melanoma proliferation control [54].
A final example is given by the enriched pathway Regulating the activity of RAC1 (associated with the Activating Invasion and Metastasis hallmark) in COREAD (Figure 7E). The Ras-Related C3 Botulinum Toxin Substrate 1 (RAC1) gene is a member of the Rho family of GTPases, whose activity is key for cell motility [55]. Previous in vitro and in vivo studies in prostate cancer demonstrated a marked increase in RAC1 activity in cell migration and invasion, and that RAC1 inhibition immediately stopped these processes [56, 57]. However, although the role of RAC1 in enabling metastasis has already been suggested, the mechanisms underlying such aberrant behaviour are poorly understood, and our findings could be used as a starting point for further investigations [58].
Another interesting case is the high level of mutual exclusivity observed in the mutation patterns involving members of the TP53 network, highly enriched in the filtered analysis of SKCM, encompassing TP63, TP73, TNSF10, MYC and SUMD1 (Figure 7F). Whereas alterations in some nodes of this network are known to be an alternative to p53 repression, conferring chemoresistance and poor prognosis [59], dissecting the functional relations between them is still widely considered a formidable challenge [60]. Our results point out alternative players worthy to be looked at in this network (particularly, among the top frequently altered, TNSF10).
Taken together, these results suggest that our computational strategy, supported by SLAPenrich, can help to identify potential novel cancer driver genes and cancer driver networks composed by lowly frequently mutated genes.
Discussion
In this paper we presented a computational pipeline, with a paired statistical framework implemented in an open source R package (SLAPenrich), to identify genomic alterations in biological pathways contributing in the acquisition of the canonical cancer hallmarks. Our statistical framework does not seek for pathways whose alterations are enriched at the individual sample level nor at the global level, i.e. considering the union of all the genes altered in at least one sample. Instead, SLAPenrich searches for pathway alterations representative of the population, considering the individual contribution of each member. It assumes that an individual mutation involving a given pathway in a given sample might be sufficient to deregulate the activity of that pathway in that sample and it allows enriched pathways to be mutated in a mutual exclusive manner across samples.
The SLAPenrich package includes (i) fully tunable functions where statistical significance criteria and alternative models, can be defined by the user; (ii) a visualization and reporting framework, and (iii) accessory functions for data management and gene identifier curation and cross-matching. Worthy of note is that many different tools provide the possibility of visualizing a mutual-exclusivity sorted sets of somatic mutations and other genomic alterations from publicly available or user defined datasets via a browser accessible software suite (e.g. GiTools [61] and cBioPortal [62]) or as a result of combinatorial pattern analysis (such as MEMo [63] and Dendrix [19]). However, none of these tools offer this feature as a mean to visualise an arbitrarily defined data matrix and, to our knowledge, there is no publicly available R implementation for this.
Beyond extraction of pathway enrichments, as illustrated with our case study on a lung cancer data set, we used SLAPenrich to perform large-scale comparative analysis of cancer mutational landscapes. In this way we have characterised the functional mutational landscape of cancer hallmarks across different cancer types. The obtained results provide a first data-driven landmark exploration of hallmark acquisitions through the preferential alteration of heterogenous sets of pathways across cancer types. The ratio of pathways mutated per hallmark seems to reflect established hallmark predominancies, and highlights peculiar patterns of altered pathways for certain cancer types. Finally, by using the identified hallmark signatures as the gold-standard signal, we re-performed SLAPenrich analyses after the removal of variants in established cancer genes and highlighted genes that contributed to those hallmarks as potential novel cancer driver genes and networks.
A number of possible limitations could hamper deriving definitive conclusions from this paper, such as the use of only mutations, the possibility that some of the analysed cohorts of patients are representative only of well-defined disease subtypes, or the limitation of our knowledge of pathways.
Nevertheless, we provide the community with a useful tool for the analysis of large genomic datasets, whose produced results (as in our hallmark analysis presented here) could open a wide range of novel insilico investigations.
Additionally, the computational tool supporting our strategy (SLAPenrich), could be of wide usability for the functional characterization of sparse genomic data from heterogeneous populations sharing common traits and subjected to strong selective pressure. For example, SLAPenrich could be of great utility in other scenarios such as the characterizion of genomic data generated upon chemical mutagenesis to identify somatic mutations involved in acquired drug resistance [Brammeld et al, under revision http://dx.doi.org/10.1101/066555]. More generally, SLAPenrich can be used to characterize at the pathway level any type of biological dataset that can be modeled as a presence/absence matrix, where genes are on the rows and samples are on the columns.
Methods
Formal description of the SLAPenrich statistical framework
Let us consider the list of all the genes G = {g1, g2,…, gn} whose somatic mutational status has been determined across a population of samples S = {s1, s2,…, sm}, and a function f : G × S → {0,1} defined as
 Given the set of all the genes whose products belong to the same pathway P, we aim at assessing if there is a statistically significant tendency for the samples in S to carry mutations in P. Importantly, we do not require the genes in P to be significantly enriched in those that are altered in any individual sample nor in the sub-set of G composed by all the genes harbouring at least one somatic mutation in at least one sample. In what follows P will be used to indicate the pathway under consideration as well as the corresponding set of genes, interchangeably. We assume that P is altered in sample si if ∃g ∈ G such that g ∈ P and f (g, si) = 1, i.e. at least one gene in the pathway P is altered in the i-th sample (Figure 1B). To quantify how likely it is to observe at least one gene belonging to P altered in sample si, we introduce the variable Xi = |{g ∈ G : g ∈ P and f (g, si) = 1}|, accounting for the number of genes in P altered in sample si. Under the assumption of both a gene-wise and sample-wise statistical independence, the probability of Xi assuming a value greater or equal than 1 is given by:
 where N is the size of the gene background-population, k is the number of genes in P, ni is the total number of genes g such that f (g, si) = 1, i.e. the total number of genes harbouring an alteration in sample si, and H is the probability mass function of a hypergeometric distribution:
 To take into account the impact of the exonic lengths λ(g) of the genes (g) on the estimation of the alteration probability of the pathway they are part of P, it is possible to redefine the pi probabilities (of observing at least one genes in the pathway P altered in sample si) as follows:
 where N′ = ∑g∈G λ(g), with G the gene background-population, i.e. the sum of all the exonic content block lengths of all the genes; k′ = ∑g∈Pλ(g) is the sum of the exonic block length of all the genes in the pathway P; n′ is the total number of individual point mutations involving genes belonging to P in sample si, and H is defined as in equation 3, but with parameters x, N′, k′, and
  . Similarly, the pi probabilities can be modeled accounting for the total exonic block lengths of all the genes belonging to P and the expected/observed background mutation rate [25], as follows:
 where k′ is defined as for equation 4 and ρ is the background mutation rate, which can be estimated from the input dataset directly or set to established estimated values (such as 10−6/nucleotide)[25].
If considering the event “the pathway P is altered in sample si” as the outcome of a single test in a set of Bernoulli trials {i} (with i = i,…, M) (one for each sample in S), then each pi can be interpreted as the success probability of the i – th trial. By definition, summing these probabilities across all the elements of S (all the trials) gives the expected number of successes E(P), i.e. the expected number of samples harbouring a mutation in at least one gene belonging to P:

On the other hand, if we consider a function ϕ on the domain of the X variables, defined as ϕ(X) = 1−δ (X), where δ (X) is the Dirac delta function (assuming null value for every X ≠ 0), i.e. ϕ(X) = {1 if X > 0) and 0 otherwise}, then summing the ϕ(Xi) across all the samples in S, gives the observed number of samples harbouring a mutation in at least one gene belonging to P:
 A pathway alteration index, quantifying the deviance of O(P) from its expectation, and thus how surprising is to find so many samples with alterations in the path-way P, can be then quantified as:
 To assess the significance of such deviance, let us note that the probability of the event O(P) = y, with y ≤ M, i.e. the probability of observing exactly y samples harbouring alterations in the pathway P, distributes as a Poisson binomial B (a discrete probability distribution modeling the sum of a set of {i} independent Bernoulli trials where the success probabilities pi are not identical (with i = 1,…,M). In our case, the i-th Bernoulli trial accounts for the event “the pathway P is altered in the sample si” and its success probability of success is given by the {pi} introduced above (and computed with one amongst 2, 4, or 5). The parameters of such B distribution are then the probabilities π = {pi}, and its mean is given by Equation 6. The probability of the event O(P) = y can be then written as
 where Fy is the set of all the possible subsets of y elements that can be selected from the trial 1, 2,…, M (for example, if M = 3, then F2 = {{1, 2}, {1, 3}, {2, 3}}, and Ac is the complement of A, i.e. {1, 2,…, M}\A. Therefore a p-value can be computed against the null hypothesis that O(P) is drawn from a Poisson binomial distribution parametrised through the vector of probabilities π. Such p-value can be derived for an observation O(P) = z, with z ≤ M, as (Figure 1C):
 Finally, p-values resulting from testing all the pathways in the considered collection are corrected for multiple hypothesis testing with a user-selected method among (in decreasing order of stringency) Bonferroni, Benjamini-Hochberg, and Storey-Tibshirani [64].
Pathway gene sets collection and pre-processing
To highlight the versatility of SLAPenrich and guarantee results’ comparability with respect to previously published studies, we have conducted the analyses described in the Results section using different collections of pathway gene sets, all included (as R objects) in our software package.
For the case study analysis on the LUAD dataset we downloaded the whole collection of KEGG [65] pathway gene sets from MsigDB [66], encompassing 189 gene sets for a total number of 5,224 genes included in at least one set.
The following differential enrichment analyses and the hallmark signature analyses were performed on a larger collection of pathway gene sets from the Pathway Commons data portal (v8, 2016/04) [67] (www.pathwaycommons.org). This contained an initial catalogue of 2,794 gene sets (one for each pathway) that were assembled from multiple public available resources, such as Reactome [68], Panther [69], HumanCyc [70], pid [71], smpdb [72], KEGG [65], ctd [73], inoh [74], wikipathways [75], netpath [76], and mirtarbase [77], and covering 15,281 unique genes.
From this pathway collection, those gene sets containing less than 4 or more than 1,000 genes, were discarded. Additionally, in order to remove redundancies, those gene sets (i) corresponding to the same pathway across different resources or (ii) with a large overlap (Jaccard index (J) > 0.8, as detailed below) were merged together by intersecting them. The gene sets resulting from this compression were then added to the collection (with a joint pathway label) and those participating in at least one of these merging were discarded. Finally, gene names were updated to their most recent HGCN [78] approved symbols (this updating procedure is also executed by a dedicate function in of the SLAPenrich package, by default on each genomic datasets prior the analysis). The whole process yielded a final collection of 1,911 pathway gene sets, for a total number of 1,138 genes assigned to at least one gene set.
Given two gene sets P1 and P2 the corresponding J(P1, P2) is defined as:

Curation of a pathway/hallmark map
We implemented a simple routine (included in the SLAPenrich R package) that assigns to each of the 10 canonical cancer hallmarks a subset of the pathways in a given collection. To this aim this routine searches for determined keywords (typically processes or cellular components) known to be associated to each hallmark in the name of the pathway (such as for example: ‘DNA repair’ or ‘DNA damage’ for the Genome instability and mutations hallmark) or for key nodes in the set of included genes or key word in their name prefix (such as for example ‘TGF’, ’SMAD’, and ‘IFN’ for Tumour-promoting inflammation. The full list of keywords used in this analysis are reported in the additional file 5. Results of this data curation are reported in the additional file 6.
Mutual exclusivity filter
After correcting the p-values yielded by testing all the pathways in a given collection, the enriched pathways can be additionally filtered based on a mutual exclusivity criterion, as a further evidence of positive selection. To this aim, for a given enriched pathway P, an exclusive coverage score C(P) is computed as
 where O(P) is the number of samples in which at least one gene belonging to the pathway P is mutated, and O′(P) is the number of samples in which exactly one gene belonging to the pathway gene-set P is mutated. All the pathways P such that C(P) is at least equal to a chosen value pass this final filter.
Hallmark heterogeneity signature analysis: genomic datasets and high-confidence cancer genes
Tissue specific catalogues of genomic variants for 10 different cancer types (breast invasive carcinoma, colon and rectum adenocarcinoma, glioblastoma multiforme, head and neck squamous cell carcinoma, kidney renal clear cell carcinoma, lung adenocarcinoma, ovarian serous cystadenocarcinoma, prostate adenocarcinoma, skin cutaneous melanoma, and thyroid carcinoma) were downloaded from the GDSC1000 data portal described in [27] (www.cancerrxgene.org/gdsc1000/). This resource (available at www.cancerrxgene.org/gdsc1000/GDSC1000_WebResources//Data/suppData/TableS2B.xlsx) encompasses variants from sequencing of 6,815 tumor normal sample pairs derived from 48 different sequencing studies [28] and reannotated using a pipeline consistent with the COSMIC database [79] (Vagrent: https://zenodo.org/record/16732#.VbeVY2RViko). Lists of tissue specific high-confidence cancer genes [28] were downloaded from the same data portal (http://www.cancerrxgene.org/gdsc1000/GDSC1000_WebResources//Data/suppData/TableS2A.xlsx). These were identified by combining complementary signals of positive selection detected through different state of the art methods [80, 81] and further filtered as described in [27] (http://www.cell.com/cms/attachment/2062367827/2064170160/mmc1.pdf).
Hallmark heterogeneity signature analysis: Individual SLAPenrich analysis parameters
All the individual SLAPenrich analyses were performed using the SLAPE.analyse function of the SLAPenrich R package (https://github.com/francescojm/SLAPenrich) using a Bernoulli model for the individual pathway alteration probabilities across all the samples, the set of all the genes in the dataset under consideration as background population, selecting pathways with at least one gene point mutated in at least 5% of the samples and at least 2 different genes with at least one point mutation across the whole dataset, and and a pathway gene sets collection downloaded from pathway commons[67], post-processed for redundancy reduction as explained in the previous sections, and embedded in the SLAPE package as R data object:
PATHCOM_HUMAN_nonredundant_intersection_hugoUpdated.RData).A pathway in this collection was considered significantly enriched, and used in the follow-up computation of the hallmark cumulative heterogeneity score, if the SLAPenrichment false discovery rate (FDR) was less than 5% and its mutual exclusive coverage (EC) was greater than 50%.
Down-sampling analyses
To investigate how differences in sample size might bias the SLAPenrichment results due to a potential tendency for larger datasets to produce larger number of SLAPenriched pathways, down-sampled SLAPenrich analyses were conducted for the 5 datasets with more than 350 samples (for BRCA, COREAD, GBM, HNSC, LUAD). Particularly, for n ∈ {800,400, 250} for BRCA and n = 250 for the other cancer types, 50 different SLAPenrich analyses were performed on n samples randomly selected from the genomic dataset of the cancer type under consideration, with the parameter specifications described in the previous section. The average number of enriched pathways (FDR < 5% and EC > 50%) across the 50 analysis was observed.
Hallmark signature analysis: signature quantification
For a given cancer type C and a given hallmark H a cumulative heterogeneity score (CHS) was quantified as the ratio of the pathways associated to H in the SLAPenrich analysis of the C variants.
The CDS scores for all the 10 hallmark composed the hallmark signature of C.
Availability of data and material
R code and data-objects are available at: https://github.com/francescojm/SLAPenrich.
Pre-processed data sources are specified in the Methods.
Funding
OpenTargets funds JSR (Projects OpenTargets15 and OpenTargets16).
Competing interests
FI is an associated editor for a Biomed Central Journal. All the other authors declare that they have no competing interests.
Author’s contributions
FI designed the statistical framework underlying SLAPenrich, conceived the hallmark heterogeneity analysis, and designed the other heuristic algorithms, conceived the visualization framework, implemented the R package, and wrote the manuscript; LGA contributed to the implementation of the visualization functions, tested and contributed to implementing the R package, curated data, and contributed to manuscript writing and revising; JB contributed to testing the R package, interpreted results and findings, contributed to manuscript writing and revising; IM contributed to the design of the validation analyses, read and edited the manuscript; DRW contributed to the design of the statistical framework and supervised its mathematical formalization; UM contributed to the interpretation of results; JSR supervised the study and contributed to the manuscript writing and revising.
Acknowledgements
We would like to thank Jorge Buendia, Mathew Garnett, and Annalisa “Lilla” Mupo for a number of insightful discussions, David Tamborero and Nuria Lopez-Bigas for critical feedback on the manuscript.
Footnotes
↵† Co-corresponding author
References
- 1.↵
- 2.↵
- 3.↵
- 4.↵
- 5.↵
- 6.↵
- 7.↵
- 8.↵
- 9.↵
- 10.↵
- 11.↵
- 12.↵
- 13.↵
- 14.↵
- 15.↵
- 16.↵
- 17.↵
- 18.↵
- 19.↵
- 20.↵
- 21.↵
- 22.↵
- 23.↵
- 24.↵
- 25.↵
- 26.↵
- 27.↵
- 28.↵
- 29.↵
- 30.↵
- 31.↵
- 32.↵
- 33.↵
- 34.↵
- 35.↵
- 36.↵
- 37.↵
- 38.↵
- 39.↵
- 40.↵
- 41.↵
- 42.↵
- 43.↵
- 44.↵
- 45.↵
- 46.↵
- 47.↵
- 48.↵
- 49.↵
- 50.↵
- 51.↵
- 52.↵
- 53.↵
- 54.↵
- 55.↵
- 56.↵
- 57.↵
- 58.↵
- 59.↵
- 60.↵
- 61.↵
- 62.↵
- 63.↵
- 64.↵
- 65.↵
- 66.↵
- 67.↵
- 68.↵
- 69.↵
- 70.↵
- 71.↵
- 72.↵
- 73.↵
- 74.↵
- 75.↵
- 76.↵
- 77.↵
- 78.↵
- 79.↵
- 80.↵
- 81.↵


