

Abstract
The emergence and spread of multidrug resistant bacteria is a global threat to human health. The problem is aggravated as a result of unnecessary and incorrect use of broad-spectrum antibiotics. One way to assure correct antibiotic use and reduce the development of antibiotic resistance is to assay the susceptibility profile of the infection before treatment is initiated. However, the current methods for Antibiotics Susceptibility Testing (AST) are too slow to be used for routine screening. Here we present a fast AST test, FASTest, that captures bacterial cells in individual nanofluidics channels and monitor their response to different antibiotics based on direct imaging. By averaging the growth rate over a few hundred cells we can determine the susceptibility to several antibiotics in less than 30 min even at cell densities as low as 104 CFU/mL of sample. This is a time scale and concentration that makes the FASTest practically useful for guiding the primary antibiotic treatment of several types of infections.
Significance Antibiotic resistance is a major problem for human health. The growth of this problem can be restricted by more specific use of antibiotics. This does however require that it is possible to test to which antibiotics the bacteria are susceptible before starting treatment of an infection. Here we show that it is possible to make an antibiotic susceptibility test faster than 30 min starting with only a thousand bacterial cells in less than 1 mL of liquid. The Fast Antibiotic Susceptibility Test, FASTest, is based on a microfluidic capturing technique and single cell growth rate measurements. FASTest is directly applicable to urinary tract infections but can be extended to other infections, for example sepsis.
INTRODUCTION
With the ever-increasing emergence and spread of antibiotic resistant bacteria, a key factor in correct treatment of infections is the ability to rapidly and robustly identify the antibiotic susceptibility profile of the infecting species in order to assure the use of an efficacious antibiotic and reduce the need for broad-spectrum drugs (1–3). Currently, a bacterial pathogen’s resistance to an antibiotic is detected either by phenotyping in the absence and presence of the antibiotic, or by genotyping for the genetic markers correlated with the previously observed phenotypic resistance (4).
Phenotypic ASTs are typically based on the detection of differential bacterial growth with and without antibiotics in liquid cultures or on solid agar plates (4). In liquid tests, detection is based on the change in optical density, while the disk diffusion method is used on solid agar plates to identify inhibition zones (5, 6) .These methods are generally reliable for detecting resistance and determining the antibiotic concentration that halts bacterial growth, making them predictive of the therapeutic utility of different antibiotics. However, since it takes 1-2 days to get a reliable readout, these methods fail to provide information on how to treat a patient in the often critical, early infection stages. As a consequence, the physician is left with the difficult choice of prescribing a broad spectrum antibiotic or risking that the first prescribed antibiotic will be ineffective.
Genotypic ASTs are based on detection of a specific genetic marker (plasmids, genes or mutations) associated with resistance phenotypes by using the common genetic tools (e.g. sequence specific amplification by polymerase chain reaction, by padlock probe mediated rolling circle amplification or whole genome sequencing) (3, 7). These tests are highly sensitive and can limit the detection time to what is needed to amplify selected DNA sequences to detectable levels, but they require advance knowledge of which resistance markers to test for. If new resistance mechanisms arise, these would go undetected and result in false negatives. Furthermore, presence of certain resistance genes/mutations does not necessarily translate into phenotypic resistance. Unlike the genotypic ASTs, the phenotypic ASTs directly assess if the antibiotic stops bacterial growth, which is the most relevant measure for the treating physician. New phenotypic ASTs have therefore been developed in recent years to decrease the detection times.
By detecting the relative abundance of 16S rRNA in liquid cultures instead of measuring optical density, the AST detection time can be pushed down to a few hours (8). Similarly, by reducing the growth volume and applying z-stack imaging to calculate the cell occupancy, the detection time for AST was decreased to ∼100 min (9). Over the last few years, microfluidics has revolutionized microbial single cell manipulation and observation (10, 11), and a fruitful direction for AST is to use microfluidics to miniaturize the bacterial incubation chambers to increase the signal to background ratio (12). One recent example of a simple microfluidic based AST method creates a concentration gradient and applies it to small cell cultures in 30 nL chambers. Analysis of images taken every 60 min allow for detection of the minimum inhibitory concentration (MIC) in 180 min (13).
One restriction in making effective microfluidics based ASTs has been the difficulty in capturing (loading) cells into the microfluidic systems. One solution is to load bacteria liquid culture mixed with liquid agarose, which solidifies upon cooling and captures the bacteria (14) (15) (16). In this approach, delivery of the antibiotic to the microfluidic agarose channel (MAC) relies on diffusion, and fast AST (1-4 hours) is achieved by tracking the single cell growth rate from phase contrast images. Another recent study builds on the success of MAC by moving it to a 96-well chip and combining it with single cell morphological analysis (SCMA). This method allows simultaneous identification of various responses of multiple species to various antibiotics and was able to detect Methicillin resistant S. aureus within 60-120 min (17). Another strategy involves pre-concentration of the samples in 2.5 nL micro-wells using a mesh which is made of stacked beads. In this way, the minimum limit of required culture density is reduced to 105 CFU/mL and by measuring the redox potential over a few of the microwells, a differential growth rate response to antibiotics could be measured in 100 min (18).
Our aim has been to develop a very fast as well as robust susceptibility test by targeting three common limitations in the existing phenotype-based AST methods. First, without a constant supply of fresh medium, medium properties such as antibiotic concentration change over time with unpredictable consequences on growth. Second, loading of the cells takes a long time when pre-growth is needed to reach a required optical density. Third, data analysis based on identifying and counting cells discards information about the instantaneous changes in the cellular growth rate.
To overcome these limitations we have developed an AST microfluidic chip based on the Mother Machine (MM) design (19). The original MM chip consists of an array of microtraps, each closed at one end and open at the other to a central flow channel. To load the microtraps, a culture of bacteria is concentrated by centrifugation, introduced to the central flow channel and time is given for the cells to randomly populate the traps by diffusion. The individual bacterium closest to the closed end of each microtraps is the mother cell and her progeny will eventually fill out the traps, pushing excess cells into the central flow channel. Using the MM and time-lapse microscopy, bacterial growth rate dynamics can be studied at the single cell level. Although the MM has been used to study the response of bacteria to antibiotics (20), it has not became a major diagnostic tool for antibiotic susceptibility testing as the loading is slow and complicated. Also, because it requires preparation of dense cultures by centrifugation, it can be stressful for the cells, and result in additional delays before any reliable steady state growth rate measurements can be performed after loading.
Our extension of the mother machine design, the xG Mother Machine (xGMM), overcomes these loading issues. The xGMM allows multifunctional parallelization such that we can use it to study either multiple bacterial cultures in the exact same growth condition or the same bacterial culture in multiple growth conditions. It allows rapid loading of even very dilute bacterial liquid cultures (e.g. from urine). Analysis of the instantaneous growth rate of ∼4000 single cells in real-time using fast image capture and analysis makes it possible to reliably detect growth rate changes in 2.5 minutes. This allows reproducible and robust antibiotic susceptibility testing in less than 30 min, which, to our knowledge, is the fastest AST method described. It is also a time scale that would allow routine screening of antibiotic susceptibility in urinary infections as well as other types of infections.
RESULTS
Design, Loading and Operation of Microfluidic Chip
A simplified design of the microfluidic chip (xGMM) is shown in Fig.1. (More details on design, number of parallelization options and alternative operation modes can be found in the supporting information (SI)). The xGMM described in this manuscript (2GMM) has two rows of cell traps (top row and bottom row), shown in Fig. 1A and B (orange regions). In each row there are ∼2000 parallel cell traps (light-orange in Fig. 1C.) that can be loaded with bacterial cells (brown) from the front channel (black). The constriction at the end of each trap prevents cells from passing to the back channel (green) while allowing the media to flow around the cells. This sieve-like design enables rapid loading and stable operation. A scanning electron microscopy image of the cell trap region from the mold of 2GMM is shown in Fig. 1D.

Design and operation details of the microfluidic chip 2GMM used in the FASTest. Arrows indicate flow direction during (A) loading and (B) running phases. The blue colored fluid represents medium 1 and the red colored fluid represents medium 2. (C) Rod shaped bacterial cells (brown) are shown in the cartoon of the cell trap region of a row of cell traps (orange). (D) Scanning Electron Microscopy image showing a part of the 2GMM mold’s cell trap region (magnification: 11×103 X). (E) A phase contrast image taken during a FASTest showing the part of one position in the 2GMM. One position corresponds to the 20x magnified phase contrast image which covers a field of view of 350 µm (width) by 260 µm (height). (E) Frames from three time points showing a section of a position during FASTest. As the cells (darker regions) grow, the progress of the cell pole towards the front-end opening of the cell traps can be seen.
In this paper, we perform the Fast AST test (FASTest) by loading a liquid culture of Escherichia coli K12 (strain MG1655) (e.g. wild type or one of the resistant mutants) (see Materials and Methods) and recording the effect of different media (e.g. one including an antibiotic and the other without any antibiotic) on the growth rate of individual cells captured in the cell traps. There are two stages of the fluidic control: Loading and Running. During loading (Fig. 1A), a liquid culture of bacteria (black) is loaded to the 2GMM from the loading port (far left). The flow into the system splits into two streams that pass through the front channel of each row of cell traps (orange). A portion of this loading culture flows through the cell traps, trapping cells in individual traps while the fluid continues through the back channel (green) to the wash-out port (green). The rest of the loading culture keeps flowing in the front channel, bypassing the cell traps. This excess loading culture reaches the manifold (far right) where it meets with the test media (blue or red) and flows out from the 2GMM through the waste port (blueblack or red-black).
In a typical experiment, fluid control is switched from Loading to Running mode when half of the cell traps are loaded. A few seconds after the switch, loading media inflow stops and test media starts to reach the cell trap regions. During running (Fig. 1B), media1 (blue) flows in from the media1 inlet port to the front channel of the top cell trap row. Meanwhile media2 (red) flows in from the media2 inlet port to the front channel of the bottom cell trap row. Each media can flow through the cell trap regions and leave the chip from the wash-out ports (green) on their respective side of the chip. Excess of test medium bypasses the cell trap region and converge at the manifold. The partial mixture of test media leaves the 2GMM from the Loading port (shown in red-blue).
We performed time-lapse (2 frames per minutes per position) phase contrast microscopy (20x magnification) with an automated X-Y translation stage, i.e. each of the 4000 cell traps were imaged every 30s. (A time-lapse movie of one position during a typical experiment can be seen in SI Movie 1). Part of one field of view is shown in Fig. 1E, displaying one of the two cell trap rows (∼80 cell traps per row in the field of view) with its front and back channels. Fig. 1F shows a time lapse of a cell trap region with 14 out of 17 of the cell traps containing one or more dividing cell(s). In each frame we can also see the dot-barcode region (dark region with dots on the right) and an empty reference trap (first trap from the right) that is empty by design (more design information in SI section: xGMM Design and Features)
Density dependence in loading time
For a clinical application it is necessary to be able to run the sample directly and not waste time on pre-processing. Ideally one would like to make the AST on just a few hundred bacteria. To test our capturing capability, we loaded the chip with different cell density cultures and measured how much time was required for loading at the different densities. To measure the cell densities accurately, a fraction of the loading sample was plated for colony counts. Different cell cultures with densities from 1100 cells/mL to 2×10⁶ cells/mL were loaded into different microfluidic chips for 10 minutes and the fraction of cell traps that were filled was monitored as a function of time (Fig. 2). 80% of the cell traps were filled within 30 seconds at a cell density of 2×10⁶. Even with the most dilute sample, 1100 cells/mL, which is much lower than clinically relevant limit, 3-4% of the cells traps were loaded, i.e. 160 traps, in 10 min. 160 cells are sufficient for a successful susceptibility test (SI section: FASTest Results of Low Cell Density Cultures. Fig. S4).
The loading time curves (Fig 2) can also be used for real time cell density determination, for example, in a urine sample. Within 30 seconds it was possible to tell if it was a severe bacterial infection and within 10 min it was possible to determine if there was a clinically relevant infection (>104/cells/mL urine) (21, 22).
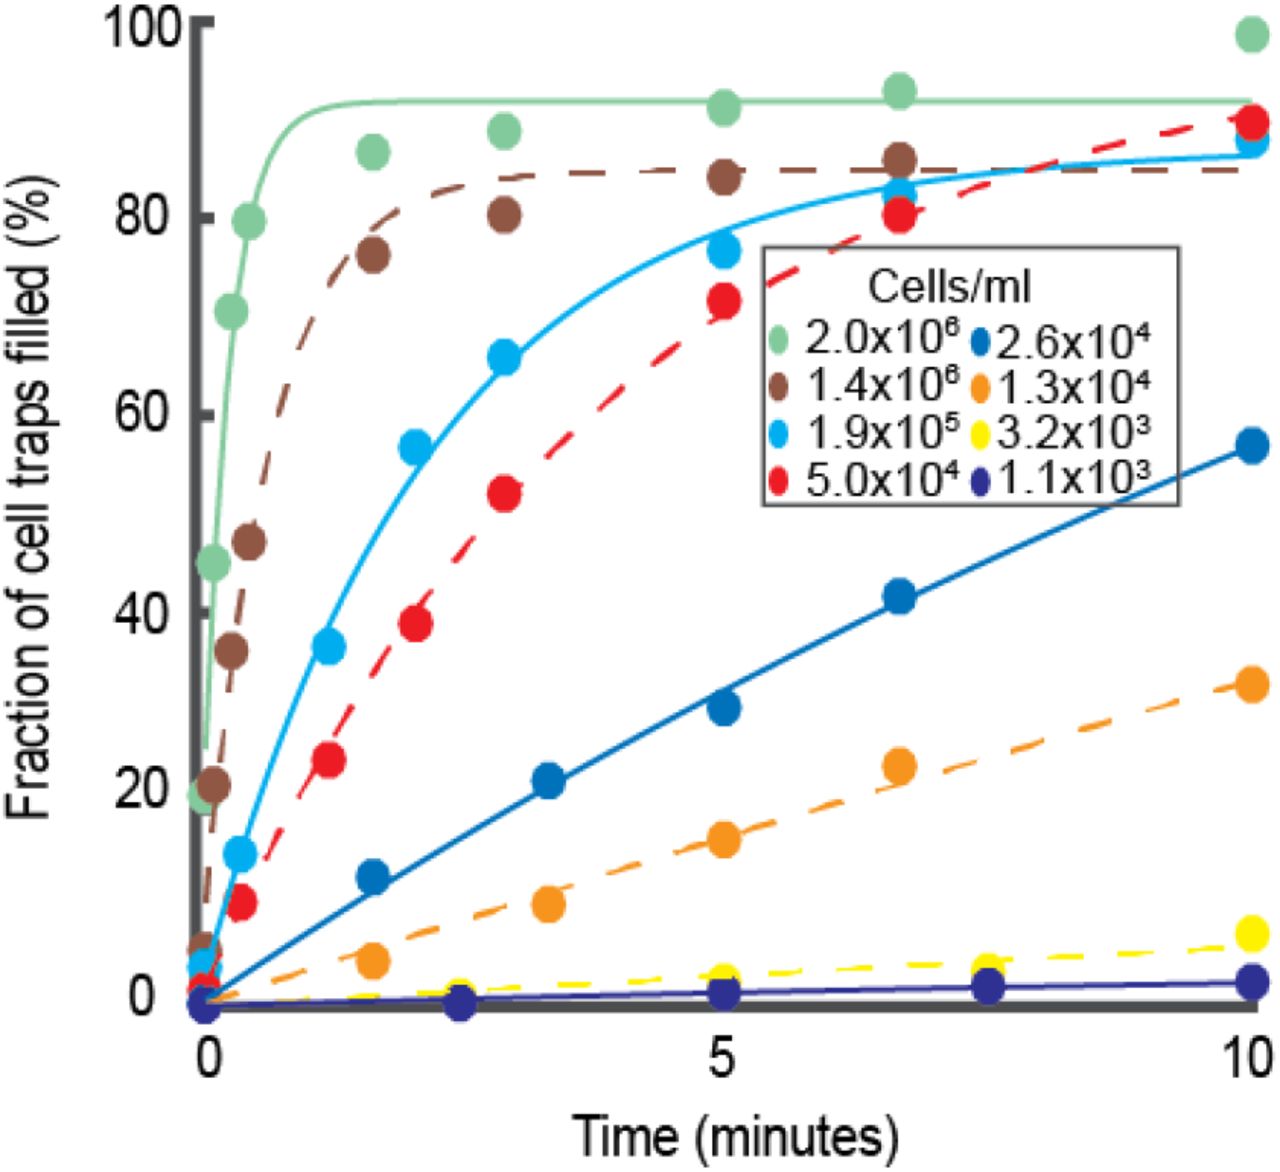
Fraction of cell traps filled at different time points during the loading of E. coli wild type cells. Each marker type shows a different cell culture with different cell density loaded into a new chip for 10 minutes.
Growth rate measurements
Growth rates were first estimated for each individual cell trap. The change in the position of the front-most cell pole in each cell trap was monitored as a proxy for the cumulative cell length changes for the cells within that trap. Fig. 3 shows an example of how the average growth rate of the cells in an individual cell trap was calculated based on this information. There are two panels: left and right. Each panel shows the average growth rate estimation of one cell trap from each of the two cell trap regions. The two cells were from an isogenic wildtype population of Escherichia coli and loaded from the same culture. The cell in the left column was given a growth media without any antibiotic and the cell in the right column was given a growth media with antibiotic to which it is susceptible. The top images of Fig. 3 show one cell trap every 5th frame of a 120 frame (60 min) experiment and the circles (blue or red) show the detected front-most cell pole position at that frame. In the middle figures, the solid dots (blue or red) show the length of the cell(s) within that cell trap through the experiment. The bottom figures show the instantaneous growth rate estimated as the relative length increase per time in a sliding window over 10 minutes.

Calculation of the growth rate in a single cell trap. In the top left image, a single cell trap is shown every 5th frame (every 2.5 min). The cell is given growth media without antibiotic. The detected cell pole position is given as a blue circle. Below that image, the corresponding length change through time is shown with the blue dots corresponding to the blue circles in the top figure. On the bottom, the same trap’s growth rate is calculated with a sliding window. The right side panels follow the same progression with the color-coding in red, and corresponds to a cell given growth media with ciprofloxacin (1 µg/mL).
In Fig. 4 we applied the growth rate calculation to each of the 2000 cell traps in both rows such that the A and B panels show length versus time for the two different media, corresponding to the columns in Fig. 3. The corresponding growth rates for individual traps are shown in Fig. 4C and D. In Fig. 4E and F, the growth rates for the individual cell traps are averaged. The frame-wise sample standard deviation is shown in light transparent color and the standard error of the mean is used to calculate a 99.9% confidence interval for the average growth rate (darker shaded region). In addition, the gray region (<10 min) indicates that the growth rate averaging-window is still expanding, i.e. the growth rate calculation is less accurate in this region. By combing the data from the two columns (Fig 4G), we can distinguish the response to the two different treatments in this experiment based on 99.9% confidence intervals’ divergence (dashed green line) at ∼12 min. At ∼19 min, the growth rate of the bottom row population, which was exposed to medium two, was ∼33% slower than the reference population.

The length (A and B) and growth rate (C and D) as a function of time is plotted for individual traps from the two different rows supplied with two different media (left one is growth media and the right one is growth media with ciprofloxacin (1 µg/ml)). The overlaid statistics (G) are given for these two rows of traps (E and F). Colored as blue for the antibiotic free row and red for antibiotic treated row, solid lines show the mean, dark shaded region show the 99.9% CI of the mean and the light shaded region show the sample standard deviation. Time of separation based on 99.9%CI and the 33% growth reduction are given as dashed and solid green lines respectively. Gray shaded region shows the region where the sliding window size for growth rate calculation has reached its maximal width, which is used for the rest of the experiment.
Fast detection of Antibiotic Susceptibility
Using the FASTest, we have determined the antibiotic susceptibility of Escherichia coli (MG1655) to two different antibiotics that act through different mechanisms: ciprofloxacin and ampicillin.
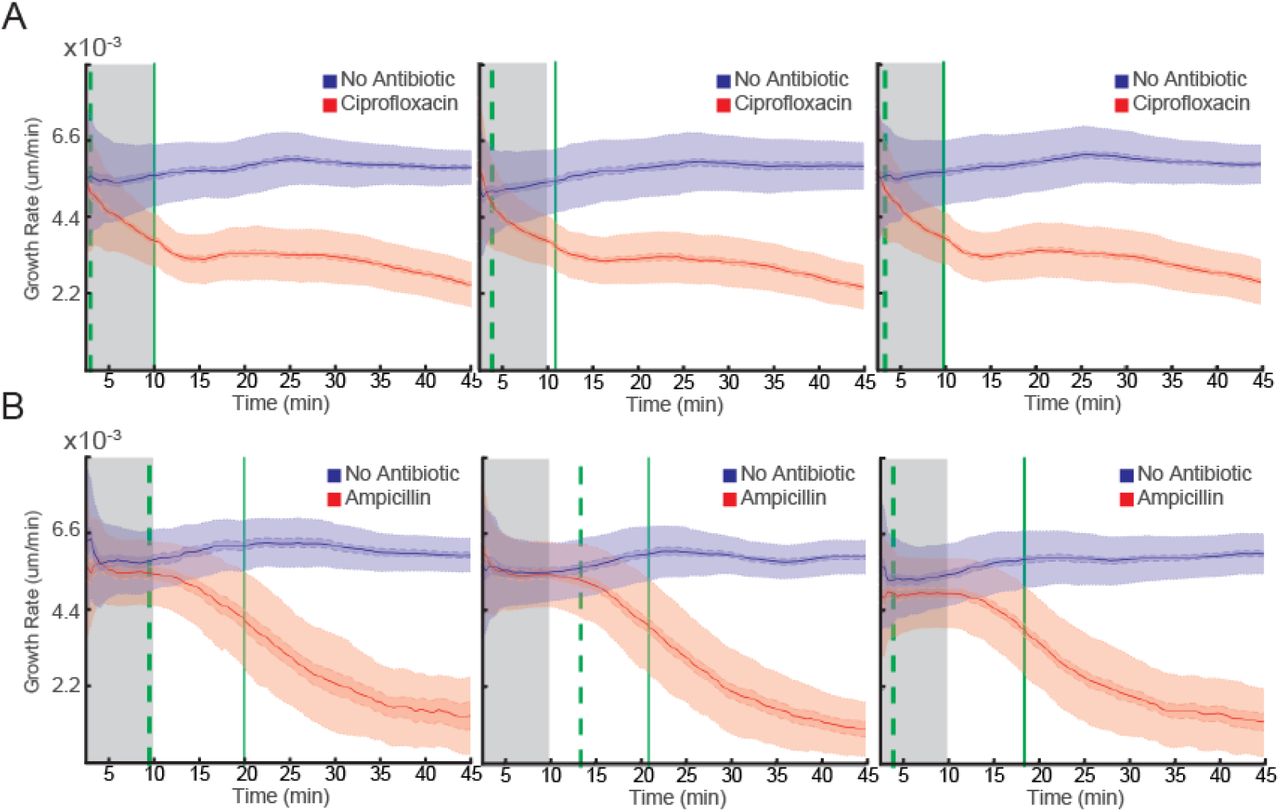
Ciprofloxacin is a broad-spectrum antibiotic from the family of fluoroquinolones. Fluoroquinolones target bacterial type II topoisomerases (DNA Gyrase and topoisomerase IV) that are essential components of DNA replication. The antibiotic impairs the activity of these enzymes, which results in lethal double strand breaks. Resistance to fluoroquinolones is widespread and increasing as they are used more often (23–27). We applied FASTest to see how rapidly we could detect the susceptibility of E. coli to ciprofloxacin. We loaded the bacteria into the 2GMM and supplied growth media without antibiotic to one row and growth media with ciprofloxacin (1 µg/mL) to the other. Based on three biological replicates (Fig. 5A), we could detect the differential growth rate in 3.5 min (s.e.m 0.14) based on 99.9% confidence intervals. In addition, we could detect that the average growth rate of the population treated with ciprofloxacin decreased more than 33% in 10.3 min (s.e.m. 0.06).

Three replicate FASTest experiments detecting the susceptibility of wild type E. coli to ciprofloxacin (1 µg/mL) (A) and to ampicillin (8 µg/mL) (B).
Ampicillin is a broad-spectrum antibiotic from the family of β-lactams. By inhibiting several of the major penicillin-binding proteins, ampicillin prevents cell wall synthesis in bacteria which ultimately leads to cell lysis. Resistance to ampicillin and other β-lactams via different types of β-lactamases is also widespread and increasing (28, 29). We applied FASTest to detect the susceptibility of E. coli to ampicillin. Similar to the test above, we supplied one row with growth media and the other with the growth media plus ampicillin (8µg/mL). In three biological repeats (Fig. 5B), we could detect the separation of the two populations in 9 min (s.e.m. 0.53). After 19.8 min (s.e.m 0.06) the growth rate of the population treated with ampicillin slowed down more than 33% compared to the control population.
Resistance-susceptibility Profile of Two Resistant Strains
To challenge the FASTest, we wanted to determine how quickly we could detect the resistance/susceptibility of bacteria that are genetically engineered to be resistant to one of the two antibiotics. This would simulate a clinically relevant scenario where a physician needs to find out which antibiotic should be used to treat an infection.
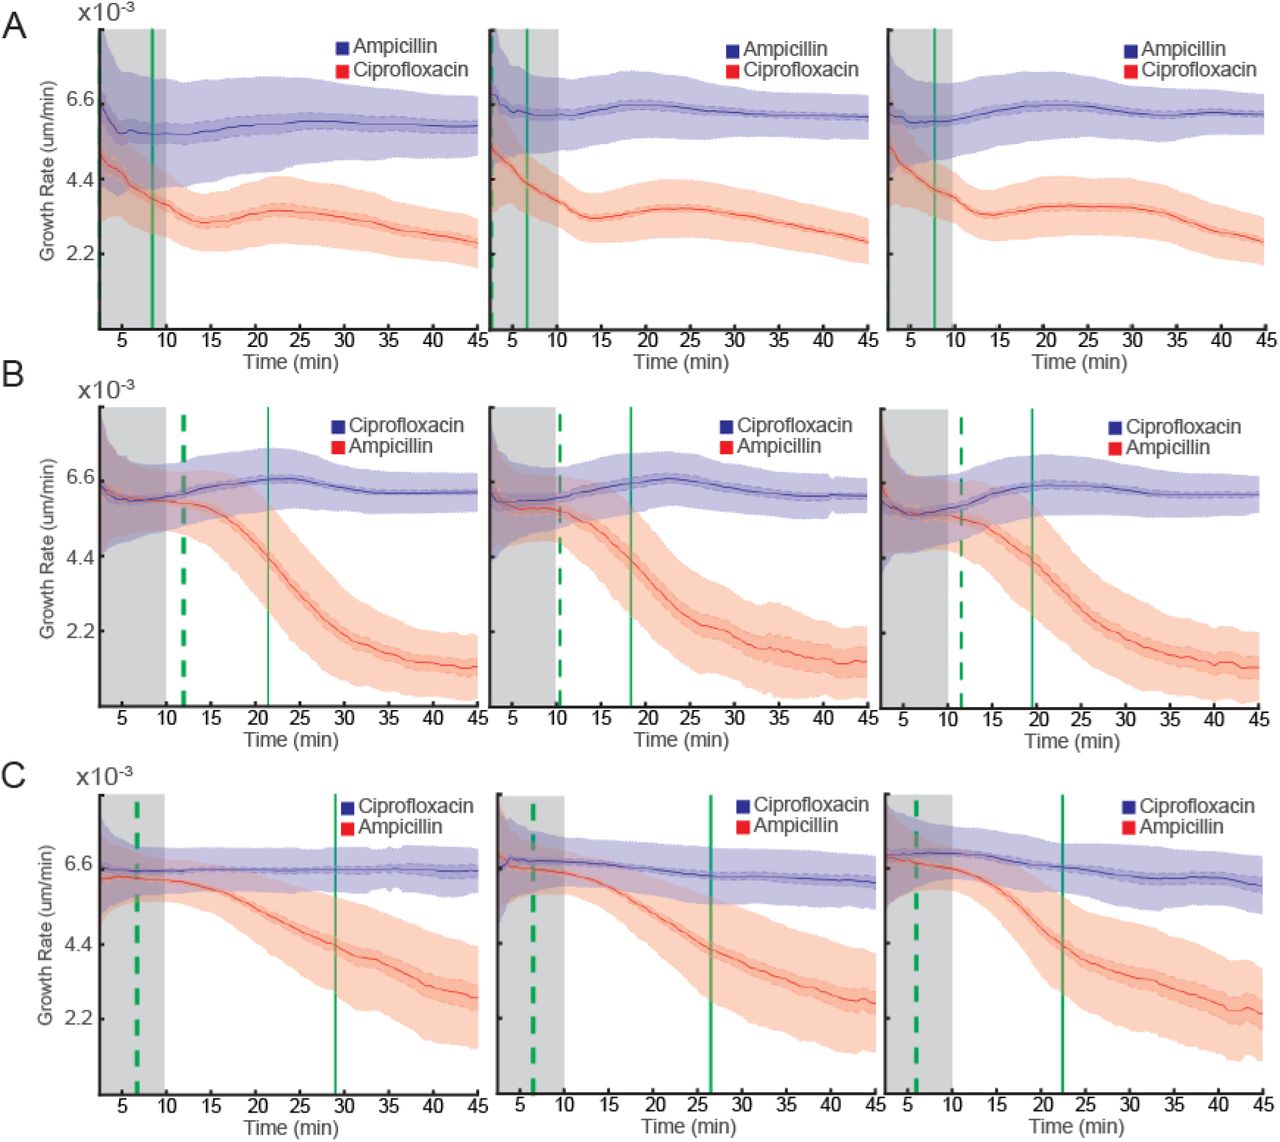
In the first scenario, we used an E. coli strain that is genetically engineered to be resistant to ampicillin due to the presence of the clinically observed bla gene (30). After loading, one of the two rows of the 2GMM is given growth media with ampicillin (8 µg/mL) while the other row is given growth media with ciprofloxacin (1 µg/mL). We compared the test response in three biological replicates (Fig. 6A), where the susceptibility of the strain to ciprofloxacin compared to ampicillin was assessed. In all three cases, separation of the two populations (based on a 99.9% CI) occurred even before we could calculate the growth rates. Thus, the first data points at 2.5 min indicate the earliest time we could separate the two populations. In addition, after 7.7 min (s.e.m. 0.14) the average growth rate of the population treated with ciprofloxacin slowed down more than 33% compared to the population treated with ampicillin. In this simulated clinical scenario, the infection should be treated with ciprofloxacin and not ampicillin.

Three replicate FASTest experiments with E. coli strains engineered to be resistant to either ampicillin or ciprofloxacin. (A) Susceptibility to ciprofloxacin and resistance to ampicillin of the ampicillin resistant strain. (B) Susceptibility to ampicillin and resistance to ciprofloxacin of the ciprofloxacin resistant strain. (C) Same as B but performed in urine.
In the second scenario, we tested an E. coli strain that is genetically engineered to be resistant to ciprofloxacin due to the introduction of several clinically observed mutations (gyrA1-S83L gyrA2-D87N parC-S80I) (31). After loading the 2GMM with this strain, one row received ciprofloxacin (1 µg/mL) while the other row received ampicillin (8 µg/mL). In 11.3 min (s.e.m. 0.07) we could tell the two populations apart (based on a 99.9% CI) and in 19.8 min (s.e.m. 0.08) we could tell that the growth rate of the population receiving ampicillin slowed down more than 33% compared to the population receiving ciprofloxacin (Fig. 6B). In this second clinical scenario, the infection should be treated with ampicillin, and not ciprofloxacin.
Fast Antibiotic Susceptibility Test for Bacteria Growing in Urine
Urinary tract infections (UTIs) are one example of infections where the FASTest can improve the medical practice by making it possible to prescribe an antibiotic to which the infecting bacteria are susceptible before the patient leaves the primary care unit. For this reason, we measured how fast the FASTest would perform if the bacteria were growing in urine instead of the standard AST media, Mueller Hinton Broth (MHB). We used a sterile urine sample inoculated with the ciprofloxacin resistant E. coli strain used in the experiments shown in Fig. 6B. This liquid culture was tested in the same way as in the previous experiments except for two modifications. Since urine is a richer media than the MHB, it allows the bacteria to become slightly larger. Thus we had to use a variant of the 2GMM with a cell trap depth & width of 1.5 µm instead of 1 µm. Secondly, sterile urine supplemented with ciprofloxacin (1 µg/mL) or with ampicillin (8 µg/mL) was used as test medium. The average growth rate of the two populations separated in 6.5 min (s.e.m. 0.08) and in 26 min (s.e.m. 0.13) the population receiving ampicillin slowed down more than 33% compared to the population receiving ciprofloxacin (Fig. 6C). This result shows that a urinary tract infection with this E. coli strain is susceptible to ampicillin but not ciprofloxacin.
DISCUSSION
The aim of this work was to determine how fast and uniformly an antibiotic impairs individual cells in a population grown under identical conditions. Apart from the obvious clinical applications, the results of these experiments are of importance for a number of basic biology studies where antibiotics are used as a research tool. For example, in the classical rifampicin runout experiments for chromosome copy number determination, it is commonly assumed that rifampicin and cephalexin instantaneously stop replication initiation and cell division in all cells although it has been indicated by recent studies that this assumption is probably incorrect (32). Similarly, it is important to know how fast chloramphenicol stops protein synthesis, and thus cell growth, in assays for fluorescent protein maturation. To study the dynamics and cell-to-cell variation in the antibiotic action mechanisms, it is critical to have a readout that is as fast as the action of the antibiotic itself. Since antibiotics impair growth, the most direct and possibly the fastest readout is to actually look at how bacterial size changes in time. The imaging of individual bacteria as well as their individual response times will however always be noisy and averaging of many cells grown under identical conditions are necessary. From the results in this paper, it is clear that it is sufficient to average over a few hundred cells to accurately measure growth rates dynamics with a time resolution of minutes.
Given that it is possible to measure near instantaneous growth rates accurately; we can ask how the growth rate changes when the bacteria are exposed to an antibiotic. As indicated by the shape of the graphs in Fig. 5 and 6, the growth rates respond in a non-trivial and antibiotic dependent way, but the response is always very similar for biological replicates. This is biologically interesting, as the response is likely to depend on activation of different survival mechanisms (i.e. envelope stress response, stringent response or general stress response) in the cells when they are exposed to different antibiotics.
However, the most striking result of this study is the possibility to determine instantaneous growth rate response to different antibiotics based on monitoring only a few hundred bacterial cells. This makes the assay medically relevant for Antibiotic Susceptibility Testing (AST). Already at 104 CFU/mL, we capture 400 cells in 10 min. 400 independent growth rate measurements are sufficient to make a highly significant estimate of the growth rate response to an antibiotic. For clarity, this statement would not be true for optical density measurements in bulk, where the key advantage of averaging over many individual cells’ measurement is lost.
The current assay focuses on bacterial growth rates that are calculated based on the length extension of individual cells. However, all features that can be determined for individual cells and averaged over many individuals would give a good readout. Potential cell features that can be assayed in this way include morphological changes of the cell wall or nucleoid, frequency of lysing, and cell division anomalies. Importantly, the readout will be specific for different antibiotics and can therefore be predetermined. We have here focused on samples and antibiotics used in urinary tract infections, which typically are caused by a single strain of bacteria. The device can however be adapted to handle mixed samples with different cell types and bacteria of different sizes. This is necessary if we wish to analyze samples directly from e.g. blood or sputum. Independent of the sample, the key principle will be true; it is sufficient to measure the single cell growth of a few hundred bacteria to get very close to the theoretical time limits for monitoring the response to an antibiotic in real time.
MATERIALS AND METHODS
The microfluidic chip
The microfluidic chip consists of two parts covalently bonded together in the lab: a cover glass (#1.5) and micromolded silicon elastomer (Sylgard 184, PDMS). For micromolding we used the standard soft lithography with details given in SI Materials and Methods. Cover glasses were pre-cleaned under running de-ionized water from dust and particles and then they were incubated in glass cleaning liquid (0.2% v/v Helmanex III in Mili-Q water) in a Teflon vessel with sonication for 45min and rinsed thoroughly with and stored in Mili-Q water. Before bonding, both the PDMS’ and the cover glass’ surfaces are cleaned and activated. The surfaces are cleaned using a UV-Ozone Cleaner for 10 min. Right after that, the surface activation is done by applying a local corona discharge from a high frequency spark generator by scanning the application probe over the surfaces for 30-60 seconds staying ∼within 5-10mm of the surfaces. The activated PDMS surface is placed on the activated surface of the cover glass to initiate the bonding. After initial attachment, the microfluidic chip is placed in 100C for at least 30min.
FASTest Protocol
All the FASTest runs described in this paper follow this common protocol: Growth of over-night culture, growth of loading culture, connection of macrofluidic setup to the microfluidic chip, positioning of the chip according to the camera, selection of positions to be imaged, running an imaging test to ensure the stability of the microfluidic chip, connecting the loading culture to the macrofluidic setup, loading the cells from loading culture, starting the antibiotic application and automated phase contrast microscopy.
Bacterial Strains
The stains used are wild-type (wt) strain: DA5438 (Escherichia coli MG1655). Ampicillin resistant strain: DA28097 (E. coli del(PlacI_lacIZYA)::amp). Ciprofloxacin resistant strain: DA20859 (E. coli gyrA1-S83L, gyrA2-D87N, parC-S80I)
Growth Media
Depending on the experiment, we used either Mueller-Hinton Broth (Sigma-Aldrich 70192-500G) or Urine as Growth Media (GM). When indicated the GM is supplemented with an antibiotic (ampicillin 8µg/mL or ciprofloxacin 1µg/mL). In preparation of urine media morning urine is collected, centrifuged for 30min at 4°C to get rid of the large debris by pelleting and then filtered (nitrocellulose filter, 0.2µm pore size). All media is supplemented with a surfactant (Pluronic® F-108, Sigma #542342, 0.85% (w/v) final concentration) to prevent the attachment of the bacteria to the PDMS surface.
Culture Conditions
Over-Night Culture (ONC): Bacteria from the glycerol stocks are inoculated into 2ml Growth Media (GM) and incubated (37C, shaking 225rpm) for ∼16h. Loading Culture: 2.5µl ONC is diluted 1:800 to total 2ml GM and incubated (37C, shaking 225rpm) 120min. Growth in the chip: The chip is continuously supplied with GM and incubated in the microscope cage incubator at 37C before, during and after the loading of bacterial culture, and also during the test. The loading culture is connected to the fluidic setup and kept in the cage incubator at 37C. GM is kept outside of the cage incubator at room temperature (21C).
Microfluidic flow control setup details
Flow direction and rate during the experiment are maintained by pressure driven flow. An electro-pneumatic controller from Elveflow (OB1 MkIII) regulates the air pressure applied to the closed fluidic reservoirs. Pressures, flow rates and tubing details are explained in SI Materials and Methods. The electro-pneumatic controller is programmed in MATLAB.
Automated Phase Contrast Microscopy
We use a Nikon Ti-E inverted microscope with 20X Objective (CFI Plan Apo Lambda DM 20X or CFI S Plan Fluor ELWD ADM 20X), phase contrast module, motorized X-Y Stage, Perfect Focus System (PFS) and a CMOS camera (The Imaging Source, DMK23U274). The setup is maintained within Cage Incubator Enclosure (custom made by Okolab), where the temperature is maintained at 37C by a temperature controller (World Precision Instruments, Airtherm-Atx). Both the microscope and the camera is controlled by an open source microscopy software (MicroManager 1.4.19). Phase contrast images are acquired by the software’s multidimensional acquisition feature through which the motorized stage move the fluidic chip to 36 different positions. Each position is imaged every 30 seconds. Each experiment is 60 minutes and consists of each of the 36 positions imaged for 120 frames.
Image Processing
The images are processed for detection of each row in the raw image, cell traps and empty traps in each row, removing background and performing pole detection to obtain the cell pole detection in each frame of each position using an algorithm we have developed in MATLAB. Details of this algorithm is given in SI Materials and Methods.
Data Analysis
For cell pole tracking we use μTrack (33). For growth rate calculation of individual cells, we apply a sliding window of data points (length) and fit a linear function to the logarithm of them. The sliding window grows from 4 to 20 frames in the beginning of the experiment and stay at 20 frames afterwards. We filter some data based on fixed criterion to remove misidentified particles or cells that are dead from the beginning as well as the traps that are overly filled or left empty during the loading. Details of filters applied are given in SI Materials and Methods.
ACKNOWLEDGMENTS
This work was supported by the European Research Council (J.E.), the Swedish Research Council (J.E. and D.I.A.), and the Knut and Alice Wallenberg Foundation (J. E.). We thank David Fange for building the microscope, Irmeli Barkefors and Micheal Lawson for help with the manuscript, and Joachim Fritzsche for the SEM images.
REFERENCES


