

Abstract
Salamanders (Urodela) have among the largest vertebrate genomes, ranging in size from 10 to 120 pg. Although changes in genome size often occur randomly and in the absence of selection pressure, non-random patterns of genome size variation are evident among specific vertebrate lineages. Several reports suggest a relationship between species richness and genome size, but the exact nature of that relationship remains unclear both within and across different taxonomic groups. Here we report i) a negative relationship between haploid genome size (C-value) and species richness at the family taxonomic level in salamander clades; ii) a correlation of C-value and species richness with clade crown-age but not with diversification rates; iii) strong associations between C-value and either geographical area or climatic niche rate. Finally, we report a relationship between C-value diversity and species diversity at both the family and genus level clades in urodeles.
Introduction
Genome size in vertebrates varies more than three hundred fold from 0,4 picograms (pg) in pufferfish to over 120 picograms (pg) in lungfish (Gregory 2015). Most of the variation in vertebrate genome size corresponds to differences in non-coding DNA such as transposable elements, microsatellites and other types of repetitive and intergenic DNA (Metcalfe and Casane 2013). The DNA accounting for differences in genome size between related species has been considered devoid of any universal function such as gene regulation, structural maintenance and protection against mutagens (Palazzo and Gregory 2014). Genome size, however, is known to have a direct impact on important physiological parameters such as cell size, cell cycle duration and developmental time (Van’t Hof and Sparrow 1963, Cavalier-Smith 1978, Francis, Davies et al. 2008).
Numerous studies have reported either a positive or negative relationship between genome size (C-value) and species richness in vertebrates (Kraaijeveld 2010, Bromham 2011, Canapa, Barucca et al. 2015). C-value, for example, is positively correlated with species richness in fish (Mank and Avise 2006, Smith 2009), but negatively correlated in other taxa such as Amhibia and plants (Vinogradov 2003, Knight, Molinari et al. 2005). Likewise, across vertebrates, C-value has been found to be negatively associated with species richness, but only at the higher class-taxonomic level (Olmo 2006). The strongest association between genome size and species diversity was observed at C-values greater than 5 pg. Consistent with reduced species diversity in vertebrates with large genomes, extinction risk was found to increase with genome size (Vinogradov 2004). Consequently, species richness in a clade might correlate negatively with the proportion of repetitive DNA present in the respective species’ genomes (Olmo 2006), suggesting that either evolvability (propensity to speciate) or extinction risk varies according to the amount of non-coding DNA present in the genome.
Several hypotheses, both adaptive and non-adaptive, have been proposed to explain the relationship between C-value and species richness. The mutational hazard hypothesis, for example, proposes that large genomes impose a constraint on rates of speciation, presumably due to differences in life history traits such as body size and developmental rates (K-selected versus r-selected strategists) (Lynch and Conery 2003, Knight, Molinari et al. 2005, Larson 2011, Bromham, Hua et al. 2015). At the same time, larger genomes are more prone to DNA damage (Sparrow, Nauman et al. 1970, Conger and Clinton 1973, Vilenchik and Knudson 2003, Vilenchik and Knudson 2006). Consequently, larger genome sizes increase the number of mutations that can negatively impact genome stability and genetic integrity (Schneider, Liu et al. 2015, Mohlhenrich and Mueller 2016). The giant genomes of several plant and animal species might therefore have evolved either because of lower mutation rates in these taxa or simply because of genetic drift (Lynch and Conery 2003, Mohlhenrich and Mueller 2016, Lefébure, Morvan et al. 2017). These differing but not mutually exclusive hypotheses suggest that the relationship between C-value and species richness operates at several different levels of selection including the population level (Gregory 2004).
A more recent hypothesis based on the eukaryotic DNA replication and repair program proposes an underlying molecular mechanism to account for the frequently observed negative association between C-value and species richness (Herrick 2011). DNA repair systems are known to vary significantly among species, which might influence the respective rates of DNA sequence evolution (Britten 1986). Accordingly, as genomes increase in size during evolution, the DNA replication and repair program adapts to the growing mutational hazard, thereby limiting DNA damage to sub-lethal levels (Herrick and Bensimon 2008). Studies have shown, for example, that plant species with larger genomes repair damaged DNA at least as effectively as species with smaller genomes (Einset and Collins 2018), indicating that enhanced DNA repair systems compensate for the inevitably higher DNA damage levels incurred in larger genomes (Al Mamun, Albergante et al. 2016). Hence, instead of posing a hazard at the molecular levels of DNA damage and mutation rate, large genomes with disproportionate amounts of neutral or nearly neutral DNA might, paradoxically, act to stabilize the genome via enhanced DNA damage/repair systems (Herrick 2011). At the same time, correspondingly lower rates of genetic turnover (substitutions, recombination, insertions/deletions etc.) might limit the genetic diversity on which natural selection acts, thus limiting species diversity (Hidalgo, Pellicer et al. 2017).
Several studies support the DNA damage/repair hypothesis along three main lines of evidence. First, levels of genetic diversity in salamanders, frogs and mammals vary considerably in a genome size dependent manner (Pierce and Mitton 1980, Karlin and Means 1994). One study, for example, reported that Anura have higher levels of genetic polymorphism than Caudata but significantly smaller genomes (Nevo and Beiles 1991). Salamanders also have lower levels of heterozygosity in protein coding genes than do other vertebrates with smaller genome sizes (Matsui, Tominaga et al. 2008). Moreover, non-transforming salamanders, which have larger genomes on average, have correspondingly lower levels of heterozygosity compared to transforming salamanders (Shaffer and Breden 1989). Whether or not this variation is due to a genome size specific effect or some other explanation such as effective population size remains unresolved (Larson 1981, Parker and Kreitman 1982).
Second, two recent studies have shown that salamanders have on average exceptionally low nucleotide substitution rates (Herrick and Sclavi 2014, Mohlhenrich and Mueller 2016), confirming and extending earlier studies on mutation rates that suggest lower rates of molecular evolution in vertebrates with exceptionally large genomes (Dores, Sollars et al. 1999, Kozak, Costantino et al. 2005). The study on lungfish (C-value: 40 to 138 pg) showed, for example, that they have slower rates of molecular evolution than frogs (1 to 12 pg), while frogs have slower rates than mammals (1.7 to 6.3 pg). A more recent study on lungfish confirms this general trend, but with some exceptions (Biscotti, Gerdol et al. 2016).
Third, even earlier studies on rates of karyotype evolution showed that salamanders have slower rates of genome evolution than frogs, while frogs have slower rates than mammals (Wilson, Sarich et al. 1974, Bush, Case et al. 1977, Bengtsson 1980). A more recent study on karyotypic diversification rates at the family level of mammalian clades supports these findings (Martinez, Jacobina et al. 2017). The observed slower karyotype diversification rates in large genomes are consistent with other observations that large genomes in plants, animals and insects experience slower rates of DNA loss and, consequently, genome size evolution (Wilson, Sarich et al. 1974, Bensasson, Petrov et al. 2001, Sun, López Arriaza et al. 2012, Kelly, Renny-Byfield et al. 2015, Pellicer, Hidalgo et al. 2018).
Together, these findings suggest that large genomes tend to be associated with slower rates of molecular evolution (genetic and genomic turnover), which might be reflected in terms of species diversity within and across different but closely related taxonomic groups and clades (Böhne, Brunet et al. 2008). The Anura, for example, have smaller genomes on average that are evolving more rapidly compared to Caudata. (Liedtke, Gower et al. 2018). At the same time, the Anura contain correspondingly more species-rich clades than do Caudata (Pyron and Wiens 2011). This observation raises the question of whether an inverse relationship between species richness and genome size, and/or genome diversification, persists at lower taxonomic levels within the salamander clade as the earlier studies on rates of karyotype evolution have suggested (Bush, Case et al. 1977, Bengtsson 1980).
Genomic turnover (eg. substitutions, translocations, deletions and amplifications, etc.) is more easily assessed in terms of variation in genome size across taxonomic clades with large genomes, since observable differences in genome size reflect underlying mutational processes occurring over evolutionary time (Feschotte and Pritham 2007, Kapusta, Suh et al. 2017). The large and widely differing sizes of salamander genomes therefore offer an attractive proxy to examine any potential association between species richness and genome size variation (Sessions 2008). Several variables likely influence the dynamics of both species richness and genome size, in particular evolutionary time (as measured by clade crown age), geographic range and environmental heterogeneity. How these variables impact genome size evolution has been the focus of intense interest for many years. In the following, we examine the relationships between species richness, C-value and genome size diversity within the Caudata.
Materials and methods
Genome sizes
were obtained from the Animal Genome Size Database (Gregory 2015). C-value refers to haploid nuclear DNA content (1C). Reported polyploids, when indicated in the Animal Genome Size Database, were removed from the analyses. Average C-values were determined for each species when more than one C-value is recorded in the database. These values were used to calculate the average C-value of each family-level clade and each genus-level clade. The distributions in genome size for each salamander family and among the genera of Plethodontidae have been published previously (Herrick and Sclavi 2014).
The data on crown age, stem age, species diversity, niche rate and geographic area
were obtained from Pyron and Wiens (Pyron and Wiens 2013). Both the maximum likelihood (ML) and the time-calibrated trees used here were obtained from those of Pyron and Wiens (Pyron and Wiens 2011, Pyron 2011). They obtained the time-calibrated tree by determining divergence times from a set of fossil constraints using treePL developed by S.A. Smith (Smith and O’Meara 2012), and applied to the ML phylogeny determined previously for 2871 species using data from 3 mitochondrial and 9 nuclear genes (Pyron and Wiens 2011). They determined species diversity from the assignment of all known amphibian species to clades as classified in their phylogeny (Pyron and Wiens 2011). Species richness at the genus level was determined by counting the number of species per genus in the Pyrons and Wiens tree. Niche rate is defined as inKozak and Wiens (Kozak and Wiens 2010). The radiation time at the genus level was obtained from TimeTree (http://www.timetree.org). The species level area was obtained from the IUCN Red List (http://www.iucnredlist.org/initiatives/amphibians/analysis/geographic-patterns). The SAGA software (Conrad et al 2015) was used to measure the genus-level area.
The Pyrons and Wiens ML and time-calibrated trees were used to create trees at the family or genus level. Species were assigned to families at first using the taxize package in R (Chamberlain and Szöcs 2013). These were manually verified against the taxonomy of the Pyrons and Wiens tree. The HighLevelTree function in the EvobiR package in R by Heath Blackmon was used to obtain the family or genus level trees (evobiR: evolutionary biology in R. R package version 1.0. http://CRAN.R-project.org/package=evobiR).
Regression analysis
The univariate and multivariate pgls analysis was carried out in R with the caper package. The maximum likelihood value of lambda was allowed to vary while kappa and delta were set to 1 as in Kozak and Wiens (Ecology and Evolution 2016). For the pgls analysis we used the time-calibrated family or genus tree obtained from the Amphibia tree of Pyron and Wiens (Pyron and Wiens 2013) as described above, or the phylogenetic tree from Kozak and Weins (Kozak and Wiens 2010) for the Plethodontidae dataset. Data used in the regression analysis involving the coefficient of variation of C-value were arcsine square root transformed and assessed using the Shapiro-Wilks test for normality (see supplementary material). The Benjamini-Hochberg procedure was used to rank p-values with a False Discovery Rate (FDR) of 0.05.
Results
Species diversity and C-value variation at the family-level of salamander clades
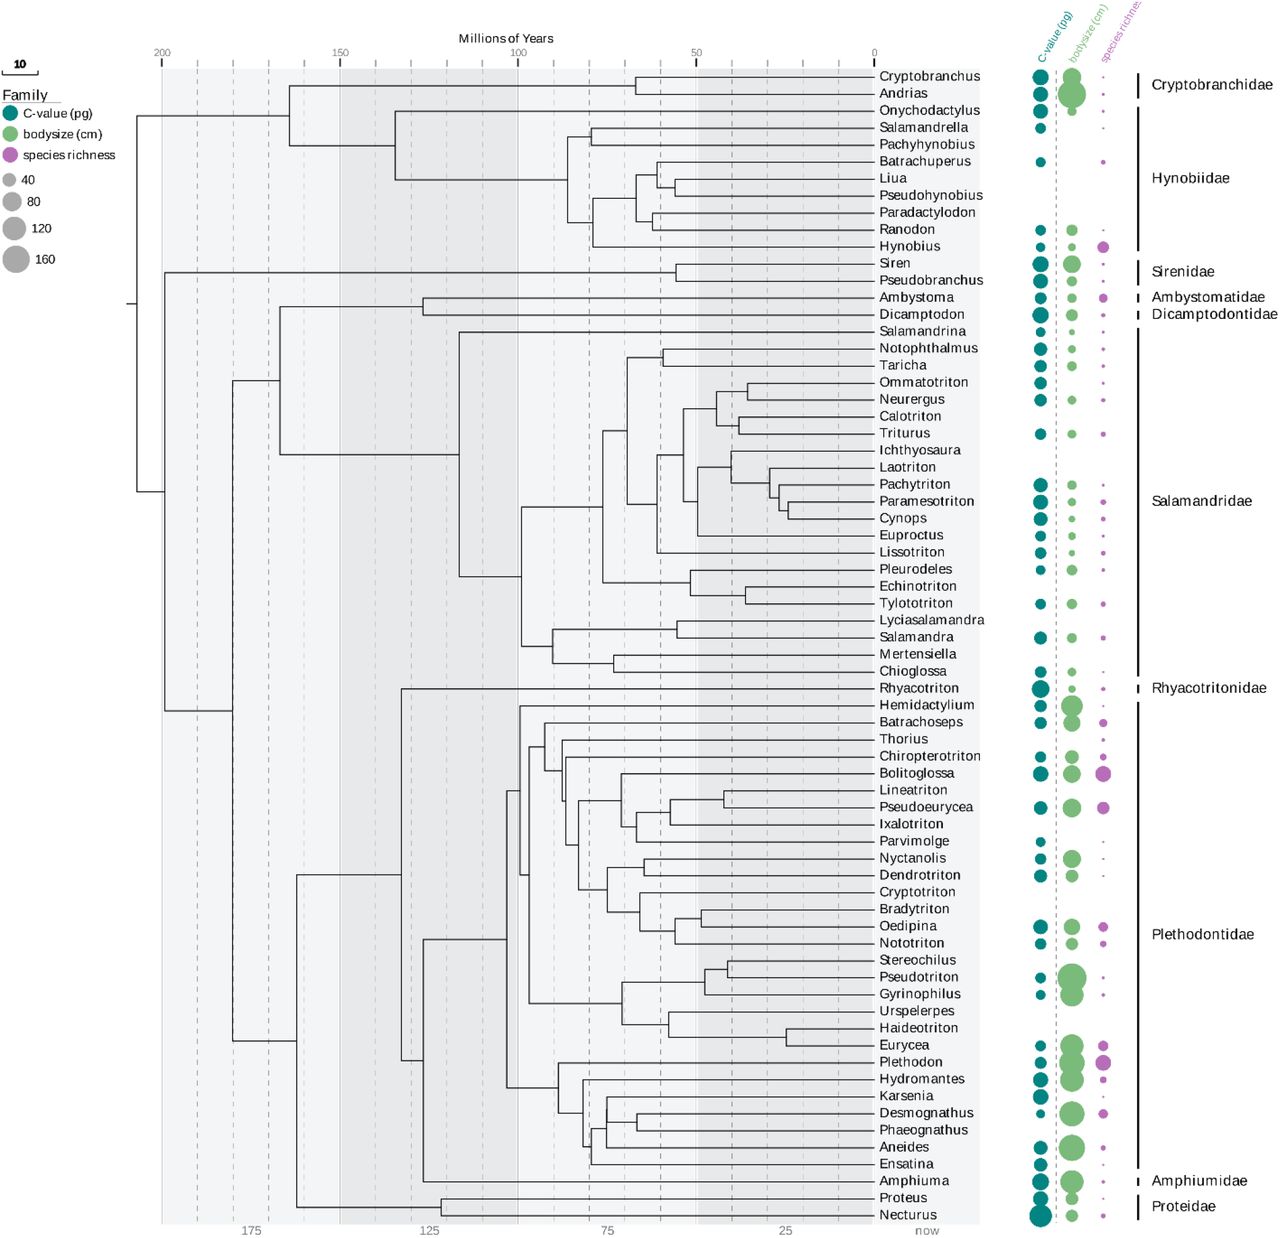
The oldest known urodeles date from 166 to 168 Mya (Marjanovic and Laurin 2014, Laurin, Canoville et al. 2015). The urodeles inhabit a wide variety of ecological niches and exhibit a large diversity of life-history traits, including small and large body sizes, paedomorphy, metamorphosis and direct development (Wake 2009). In an earlier study of Amphibia, Pyron and Wiens revealed a number of ecological correlates between species diversity and variables such as geographical latitude, geographic range and environmental energy (Pyron and Wiens 2013). Species diversity in frogs, salamanders and caecilians also varies according to abiotic factors such as humidity and temperature and biotic factors such as productivity and rates of diversification (extinction and speciation). Figure 1 shows the family level phylogenetic tree while Figure 2 shows the genus level phylogenetic tree, both derived from Pyron and Wiens (Pyron and Wiens 2011), that were used here to investigate the relationship between salamander genome size and species diversity. Substantial variation in species diversity, body size and C-value among and within clades at the family and genus level is apparent in the phylogenetic tree of the Urodela.

Crown age, but not diversification rate, correlates with clade diversity
Among animal taxa it has been reported that clade age rather than diversification rate explains species richness (McPeek and Brown 2007). A more recent study of amphibians, birds and mammals supports the finding that time (older lineages), and not diversification rates, explains extant species richness (Marin and Blair Hedges 2016). A significant positive correlation between crown group age at the family level and species diversity has also been reported in salamanders (Eastman and Storfer 2011). In contrast to these reports, our initial phylogenetic generalized least squares (PGLS) analysis at the family-level of Urodela did not confirm a significant relationship between crown age and species richness.
We determined, however, in preliminary OLS regression analyses that the family Proteidae represents an outlier (studentized residual: 2.35; studentized deleted residual: 3.94). We further determined that the outlier status of the Proteidae is due to a single monotypic genus: the European Proteus anguinus, the only genus in the Proteidae clade found outside of North America. Monotypic groups complicate estimates of crown age (Wiens 2017), which might influence the regression analyses performed here. Excluding this monotypic genus from the regression analysis changes the Proteidae family-level crown age of 121 Mya to that of the Necturus genus-level crown age of 13 Mya (www.timetree.org).
We therefore conducted the following PGLS analyses both with and without the single species Proteus anguinus to test the effect this species has on the association between the investigated variables (see Table S1 and Table 1). Phylogenetic generalized least squares (PGLS) analysis confirmed that species diversity in salamanders increases with clade crown age: older clades tend to have higher species diversity than comparatively younger clades, as expected (Table 1). In contrast to crown age, we found no correlation between stem age and clade diversity at the family level (R2 = 0.1; P = 0.8), in agreement with earlier reports on other taxa (Rabosky, Slater et al. 2012, Stadler, Rabosky et al. 2014, Wiens 2017).
Average C-value correlates with crown age but not diversification rate
The ancestral Amphibia genome (C-value ~ 3 pg) has experienced massive amplification during the evolution of the Urodela (Organ, Canoville et al. 2011, Organ, Struble et al. 2016). An early ancestor of salamanders, for example, has been estimated to have a large genome size of approximately 33.1 pg, which is similar to the reconstructed ancestral genome size of ~32 pg (Sessions 2008, Laurin, Canoville et al. 2015). An earlier study suggested that genome size in salamanders has increased with time, although the exact rate of increase remains unclear (Martin and Gordon 1995, Sessions 2008). We therefore examined the relationship between phylogenetic stem age and genome size but found no significant relationship between stem age and C-value (not shown). Examination of the relationship between crown age and C-value using the Pyron and Wiens dataset, in contrast, revealed a significant negative relationship between C-value and crown age (R2 = 0.7 P = 0.0015; Table 1).
C-value, but not body size, is associated with species richness
Figure 1 suggests that species diversity is negatively associated with both C-value and body size. Our analysis revealed an inverse relationship between species richness and body size; however, the correlation was not significant (Table 1). The relationship between species richness and C-value, in contrast, is strongly negative and significant at the family taxonomic level (R2 = 0.69 P = 0.003; Table 1). This negative trend is readily apparent in the phylogenetic tree: the sister clades Hynobidae and Cryptobranchidae, for example, differ over 2X with respect to average genome size and over 10X with respect to species diversity (Figure 1). The other two sister clades in Figure 1 exhibit a similar trend (Amphiumidae: Plethodontidae; Dicamptodontidae: Ambystomatidae).
C-value, species richness, geographic area and climatic niche rate
Older clades (crown age) have had more time to disperse over larger areas, suggesting that geographic area might correlate positively with species richness. PGLS analysis revealed a strong relationship between family clade diversity and geographic area (R2 = 0.67, P = 0.002; Table S1). Likewise, a strong negative correlation was found between C-value and geographic area: clades with smaller average genome sizes occupy larger geographic areas (R2 = 0.74; P = 0.0008; Table 1).
In order to better understand the relationship between C-value and geographic area we next examined the relationship between C-value and niche rate. Since larger geographic areas are expected to comprise higher levels of both habitat and niche diversity, we examined the individual relationships between niche rate, species richness and C-value. PGLS analyses revealed a negative relationship between niche rate and C-value (Table 1). Positive relationships were found between area and species richness and between niche rate and area (Table S2). Additionally, our analysis revealed that niche rate and diversification rate are related at the family-level of Urodela clades (R2 = 0.44; P = 0.02; Table S2), as previously reported for lower taxonomic levels (Kozak and Wiens 2010). This observation is consistent with a more extensive study showing a strong correlation between diversification rate and niche rate at family level clades in mammals (Castro-Insua, Gómez-Rodríguez et al. 2018).
Genome size diversity and species diversity
Together, our results suggest a potential relationship between species diversity and genome size diversity. We next investigated if clades with higher levels of species diversity have correspondingly higher levels of genome size diversity. Genome size is expected to evolve in a manner that is proportional to C-value, suggesting that larger genomes are changing faster in size compared to smaller genomes (Oliver, Petrov et al. 2007). The coefficient of variation (CV) of the log of C-value was used here to assess genome size diversity (see materials and methods). Comparing salamander families, there appeared to be a negative relationship between average C-value in each clade and its corresponding CV; however, the relationship was not significant (R2 = 0.38; P = 0.08; Table 1).
Examining the relationships between CV of C-value and the other investigated variables, a strong relationship was found between genome size diversity and species richness at the family taxonomic level (Table 1), as expected if genome size has been evolving in parallel with species richness since the emergence of the different family-level salamander clades. Significant correlations between CV of C-value and either crown age or area were also found; however, only the correlations between species richness and CV of C-value remained significant following Benjamini-Hochberg analysis (Table 1).
Clade age, species richness and C-value at the genus level
Extending our examination of the relationship between clade age and species richness to genus-level clades across the Urodela phylogenetic tree, we initially failed to find a clear correlation between clade age and species richness in 50 different genera. Excluding the monotypic phyla, however, revealed a significant correlation between genus radiation time and species richness (R2 = 0.62; P = 2 x 1E-9, Table 2). When examining the relationship between CV of C-value and radiation time we also found a significant correlation between these two variables (R2= 0.21; P = 0.008; Table 2). Multiple regression analysis showed that the contribution of each variable, CV of C or radiation time, to species richness was not substantially different from their individual univariate contributions (Table 2). Phylogenetic path analysis at the genus level further suggests that the best of all possible models corresponds to the one in which species diversity and genome size diversity depend similarly on radiation time, as expected (not shown).
A significant relationship has previously been reported between diversification rate and niche rate in 15 plethodontid clades (Kozak and Wiens 2010). Using the values of niche rate for plethodontids reported in Kozak and Wiens 2016, we found a significant association between C-value and niche rate at this lower taxonomic level (R2 = 0.48; P = 0.002; Table 3), similar to what was observed at the family level (R2 = 0.58; P = 0.006; Table 1). In contrast, we did not find that C-value or CV of C-value is associated with either crown age, geographic area, diversification rate, or species diversity in the plethodontid clade (Table 3).
Discussion
We report here a relationship between average genome size and species richness at the family level of Urodela clades (Table 1). At both genus and family levels, a significant relationship was also found between C-value diversity (CV of C) and species richness in a clade. Phylogenetic path analysis at the genus level suggests that these two variables, genome size diversity and species richness, depend similarly on crown age, suggesting that these two traits are evolving independently of each other (not shown). Together, our findings provide evidence that C-value and variation in C-value constitute additional traits associated with species diversity, at least in urodeles. Examining other factors such as clade age, geographic area and rate of climatic-niche evolution suggests that the relationship between genome size and species diversity is mediated directly or indirectly through several different variables.
What is the nature of the relationship between average C-value and these different ecological variables in the Urodela? Sessions reported that the range in genome size in family-level Urodela clades tends to increase as their average C-values decrease (Sessions 2008), suggesting a potential relationship between genome size diversity and average genome size in a clade. Our analysis does not support a significant relationship between CV of genome size and C-value. We did find, however, a significant relationship between CV of genome size and species richness, suggesting that diversification of genome size coincided with diversification of species in a clade (Table 1). In contrast, genome size diversity (CV of C) is not significantly related to either niche rate, geographic area or diversification rate at the family taxonomic level (Table 1). These observations suggest that changes in genome size are associated directly or indirectly with speciation events in urodeles, consistent with findings in plants that rates of genome size evolution correlate with rates of speciation (Puttick, Clark et al. 2015).
We note that the observations made here concerning average C-value and species diversity apply predominantly to the family-level of Urodela clades. At lower taxonomic levels such as the plethodontids, the relationship between genome size and species richness shows no consistent pattern. The Bolittoglossinae, for example, tend to have larger clade-average genome sizes but higher species diversity than other genera in the plethodontids. Indeed, the Plethodontidae as a group exhibit the highest levels of species diversity among family-level Urodela clades (Wake 2009), and have correspondingly elevated levels of genome size diversity and substitution rates (Herrick and Sclavi 2014). We suggest that genome size diversity, rather than genome size itself, reflects the correspondingly higher substitution rates previously reported for the Plethodontidae (Herrick and Sclavi 2014).
Together, our analyses support the Geographic Range Hypothesis, according to which taxa with wider geographic distributions have higher probabilities that genetic changes such as indels, chromosomal inversions and transposon-mediated modifications in genome size will become fixed in a population (Feder, Gejji et al. 2011, Martinez, Jacobina et al. 2017). If habitat and niche availability both increase with geographic area, then our observations suggest that changes in genome size in urodeles might have occurred in parallel with adaptations that made available habitats and niches more accessible to dispersing ancestral populations, but only over longer evolutionary periods (family level clades).
How might variation in C-value contribute to speciation events? The recent study on karyotypic diversification rates at the family level of mammalian clades suggests that large, past geographic distributions in heterogenous environments might have favored higher levels of chromosomal diversity; or conversely, higher rates of chromosomal diversification might have promoted colonization of new habitats and expanding geographic ranges (Martinez, Jacobina et al. 2017). These results are consistent with the earlier observations on the rate of karyotype diversification in mammals, frogs and salamanders (Wilson, Sarich et al. 1974, Wilson, Bush et al. 1975, Bush, Case et al. 1977, Bengtsson 1980), suggesting that taxonomic groups with larger genomes on average have slower rates of genome evolution (Hooper and Price 2015, Leaché, Banbury et al. 2016).
Based on these findings, we propose that rates of variation in C-value and genomic organization (heterochromatin content and gene synteny), in addition to changes in genome size, might coincide with rates of variation in species richness. These observations suggest that changes in C-value, and hence changes in the amount and/or organization of non-coding DNA in the vertebrate genome, are associated with the allelic incompatibility believed to drive reproductive isolation and speciation in salamanders. We are currently investigating the hypothesis that genome diversification rates and corresponding levels of genome size and karyotype diversity, rather than absolute C-value, explain rates of molecular evolution and rates of speciation in Amphibia and other eukaryotes.
Acknowledgements
BS is supported by a grant from Human Frontier Science Program (RGY0079). JH benefited from support from John Bechhoefer’s lab, Physics Department, Simon Fraser University.


