

Abstract
Recent technological developments allow investigation of the repeatability of evolution at the genomic level. Such investigation is particularly powerful when applied to a ring species, in which spatial variation can be used to represent the evolutionary changes that occurred during the evolution of two species from one. We examined patterns of genomic variation among three populations of the greenish warbler ring species, using genotypes at 13,013,950 nucleotide sites along a new greenish warbler consensus genome assembly. Genomic regions of low within-group variation are remarkably consistent between the three populations. These regions show high relative differentiation but surprisingly low absolute differentiation between populations. We propose that these regions underwent selective sweeps over a broad geographic area followed by within-population selection-induced reductions in variation. A surprising implication of this “sweep-before-differentiation” model is that genomic regions of high relative differentiation may have moved among populations more recently than regions elsewhere in the genome.
Introduction
The question of “How repeatable is evolution?” has captured the interest and imagination of generations of scientists, and motivated much empirical and theoretical research (e.g., Gould 1990; Travisano et al. 1995; Wichman et al. 1999; Wood et al. 2005; Conte et al. 2012; Meyer et al. 2012; Renaut et al. 2014; Bauer and Gokhale 2015). Thought experiments and empirical investigations of this question have mostly focused on phenotypic patterns and/or genetic changes in particular genes of interest, and answers appear to depend on the timescale considered. Considering long timescales in the history of life, Gould (1990) wrote that “any replay of the tape would lead evolution down a pathway radically different from the road actually taken.” On a much shorter timeframe, Lenski and others (e.g., Meyer et al. 2010) have shown strikingly parallel evolution in replicate laboratory populations of bacteria. On intermediate timescales, groups such as stickleback fish (Colosimo et al. 2005) and sunflowers (Renaut et al. 2014) show strong patterns of parallel evolutionary responses to similar environments.
The rapid development of genomic technology now allows expansion of investigations of the repeatability of evolution to DNA sequences across the whole-genome scale (Lobkovsky and Koonin 2012). When an ancestral species evolves into several differentiated descendent species, do similar regions of the genome appear to play a key role in differentiation? Alternatively, are the patterns highly unrelated, with little similarity between daughter species in the regions that display differentiation? Investigations of such questions are most powerful when they involve more than just two populations. Here, we investigate patterns of genomic differentiation in a ring species (Mayr 1942; Cain 1954; Irwin et al. 2001c), a situation that allows comparison of the structuring of genomic differentiation at a range of spatial and temporal scales. In a ring species, two terminal forms are reproductively isolated (to a large degree) where they co-occur, but these forms are connected by a long chain of populations encircling an uninhabited area; through this chain there is a gradient in phenotypic and genetic traits and little if any reproductive isolation. We examine patterns of genomic differentiation between the two terminal forms as well as between each of them and a population halfway along the chain connecting them, and we ask how similar the patterns of differentiation are between the three comparisons.
The ring species under investigation is the greenish warbler (Phylloscopus trochiloides) species complex (Fig. 1), which consists of two forms breeding in Siberia (P. t. viridanus in the west, and P. t. plumbeitarsus in the east) and a connecting chain of three subspecies to the south that form a gradient around the uninhabited Tibetan Plateau (P. t. ludlowi in the western Himalayas, P. t. trochiloides in the central and eastern Himalayas, and P. t. obscuratus in central China; Fig. 1; Ticehurst 1938; Mayr 1942). Previous genetic and phenotypic analysis (Irwin 2000, 2012; Irwin et al. 2001b, 2005, 2008; Alcaide et al. 2014) has indicated that there is strong (but not complete) reproductive isolation between viridanus and plumbeitarsus where they meet in central Siberia, whereas around the southern ring there is little reproductive isolation, although there are indications of some phases of geographic separation followed by secondary contact. The geographic history of the complex is likely very complicated, given the Pleistocene history of many phases of glaciation cycles, but it is clear from the genetic and phenotypic data that west Siberian viridanus expanded into Siberia from central Asia (i.e. from the western side of the current ring) and east Siberian plumbeitarsus expanded into Siberia from central China (i.e. from the east side of the current ring).

The gradient around the greenish warbler ring is shown in shades of gray, and colors indicate the populations (circles) and population comparisons (lines) shown in subsequent figures (note the green and orange line colors represent population comparisons, not other populations as in previous publications). Names of subspecies are indicated, with the three being compared in larger font.
Phenotypic variation around the ring indicates that there has been a combination of parallel and divergent evolution in different traits during the two northward expansions. Body size, seasonal migration distance, and song length have evolved in parallel, with the two Siberian forms (viridanus and plumbeitarsus) showing strong similarity to each other and both differing in the same way from the southern forms; parallel evolution in these traits is likely due to parallel shifts in habitat and other environmental characteristics during the two northward expansions. In contrast, plumage patterning, migratory routes, and song and call structure have evolved strong differences between the Siberian forms. Some of these differences (e.g. plumage and structure of vocalizations) are likely due to the complexities of sexual and social selection in causing highly stochastic patterns of evolution (Irwin 2000, 2012; Irwin et al. 2001b, 2008). Hence, based on phenotypic patterns, we have reason to expect some parallel and some divergent selection on the genome.
A number of studies of genomic differentiation between pairs of populations have observed distinct chromosomal regions with much higher relative differentiation (i.e., FST) than most of the genome (e.g., flycatchers, Ellegren et al. 2012, Burri et al. 2015; mosquitos, Turner et al. 2005; rabbits, Carneiro et al. 2014; mice, Harr 2006; butterflies, Nadeau et al. 2012); these regions have been referred to as “genomic islands of speciation,” “genomic islands of differentiation,” and “genomic islands of divergence.” Two primary explanations have been given for such regions (Nachman and Payseur 2012; Cruickshank and Hahn 2014; Fig. 2A,B). First, in the “divergence with gene flow” model (Fig. 2A), the islands of high relative differentiation form because they contain loci involved in reproductive isolation (i.e., “speciation genes”) within the hybrid zone between the two populations, causing those loci to have low gene flow between the two populations compared to other parts of the genome (Wu 2001; Nosil et al. 2009; Feder and Nosil 2010; Nosil and Feder 2012; Via 2012). Loci in high physical linkage with those speciation genes undergo hitchhiking with the speciation genes, such that an island of differentiation forms, facilitating the buildup of linked loci that contribute further to reproductive isolation. Second, in the “selection in allopatry” model (Fig. 2B), islands of high relative differentiation are not directly caused by loci causing reproductive isolation when gene flow is occurring, but rather by loci under selection in one or both populations (Noor and Bennett 2009; Turner and Hahn 2010; Nachman and Payseur 2012; Cruickshank and Hahn 2014; Delmore et al. 2015). The selection causes reduced within-population variation at the selected locus as well as areas in close physical linkage; reduced within-population variation tends to be accompanied by greater relative differentiation between populations, since relative differentiation is generally estimated as a ratio of between-group nucleotide differentiation to the total nucleotide variation (the sum of between-group and within-group nucleotide variation).

Each panel depicts a history in which a single ancestral population split into two daughter taxa. In A and D there is some amount of migration between the two populations, whereas in B and C there is not. In each scenario, typical genealogies of six individuals (three in each taxon) are shown for a selected region (in red; in A, “RI locus” refers to a locus causing reproductive isolation) and a neutral locus (in grey).
In both models, close physical linkage of genes plays an important role, because linkage reduces recombination between selected loci and nearby neutral loci, preserving the association between a particular set of alleles (Feder and Nosil 2010; Nachman and Payseur 2012). Hence, there is expected to be a relationship between islands of differentiation and areas of low recombination, as observed in sunflowers (Renaut et al. 2013) and flycatchers (Burri et al. 2015). However, low recombination alone is not sufficient to cause increased relative differentiation (Nachman and Payseur 2012; Renaut et al. 2013; Burri et al. 2015); selection is also necessary, and variation in recombination rate explained only 27% of variation in relative sequence differentiation across the genomes of the flycatchers (and a great deal of variation in relative differentiation remained unexplained at the low end of the recombination axis; see Fig. 2B of Burri et al. 2015). Hence, although islands of differentiation are expected to show some association with areas of low recombination in greenish warblers, variation in selection pressures in different greenish warbler populations would have the potential to cause different patterns of relative differentiation across the genome.
Nachman and Payseur (2012) and Cruickshank and Hahn (2014) proposed a way to distinguish the divergence-with-gene-flow and selection-in-allopatry models, by examining patterns of absolute nucleotide differentiation (i.e., Dxy) between groups, rather than focusing primarily on patterns of relative differentiation (i.e., FST). Under a pure divergence-with-gene-flow model (Fig. 2A), absolute nucleotide differentiation is expected to be high in the islands of high relative differentiation, because reproductive isolation due to loci in those regions prevents those regions from flowing between populations, whereas the rest of the genome flows between populations, eventually reducing absolute differentiation. In contrast, under a pure selection-in-allopatry model (Fig. 2B), absolute differentiation is not expected to be high where relative differentiation is high; rather, increased relative differentiation in areas with loci under selection is due solely to decreased within-group variation (i.e., π). Hence, in our comparisons of patterns of genomic differentiation around the greenish warbler ring, we compare patterns of within-and between-group nucleotide variation as well as relative differentiation.
We ask several specific questions regarding genomic differentiation between three populations of greenish warblers. First, are there distinct genomic regions of high relative differentiation between populations? Second, how similar are regions of differentiation in the three pairwise population comparisons? Given that greenish warblers have expanded northward into Siberia along two distinct geographic pathways, we can compare the patterns of genomic differentiation that occurred between these two relatively independent evolutionary expansions. Third, do regions of high relative differentiation display high absolute differentiation (supporting the divergence-with-gene-flow model for the formation of such high-FST regions)? Given previous work indicating that phenotypic and genotypic variation in greenish warblers show gradients around the ring (Irwin et al. 2001b, 2005, 2008, Alcaide et al. 2014, Bradburd et al. 2016), we initially expected the divergence-with-gene-flow model to be applicable to greenish warblers. Alternatively, is high relative differentiation due entirely to low within-group variation (supporting the selection-in-allopatry model)? To test whether patterns of nucleotide variation across the genome may be explained by variation in mutation rate or recombination rate, we also analyze genomic variation in four outgroup taxa. Finally, we ask whether the Z chromosome (a sex chromosome) shows different levels of within-and between-population variation compared to autosomes, since theory and previous observational studies in other systems suggest that sex chromosomes may differentiate faster and play an especially important role in speciation (Charlesworth et al. 1987; Ellegren et al. 2012; reviewed by Oyler-McCance et al. 2015).
Results
We surveyed genomic variation in 135 adult greenish warblers and four outgroup species by mapping genotyping-by-sequencing (GBS; Elshire et al. 2011) reads to a newly generated greenish warbler consensus genome assembly. To avoid geographic biases in the probability of reads mapping, we assembled the reference genome using whole-genome sequences from three individuals dispersed widely around the ring: one viridanus, one trochiloides, and one plumbeitarsus. Putative ordering of contigs on chromosomes was determined using the zebra finch reference genome (synteny is highly conserved in birds; Kawakami et al. 2014), but our assembly contains sequence entirely from greenish warblers.
Mapping of GBS reads to the reference greenish warbler genome resulted in the identification of 580,356 single nucleotide polymorphisms among the 135 greenish warbler samples. Whole-genome relationships, as summarized using principal components analysis (PCA; Fig. S1), show the pattern expected based on previous research (Alcaide et al. 2014; see also Bradburd et al. 2016), of two highly distinct Siberian forms (viridanus and plumbeitarsus) and a progression of genomic signatures through the ring of populations to the south. Note that Alcaide et al. (2014) summarized variation in the same GBS reads, but used an entirely distinct bioinformatics pipeline and based their PCA on only 2,334 SNPs due to very restrictive filtering; the fact that the current study recovers similar patterns using much less restrictive filtering and roughly 250 times the number of SNPs gives strong confidence in the inferred relationships. We use these overall genomic relationships as a backdrop to explore patterns of variation in relative and absolute differentiation across the genome.
We first examined differentiation between three major geographic groups around the ring: viridanus in west Siberia, trochiloides in the south, and plumbeitarsus in east Siberia. To ensure that variation in sample size did not influence comparisons of patterns among these taxa, we chose 15 individuals of each taxon to include in an analysis of relative nucleotide differentiation (FST) and within-and between-group absolute nucleotide differentiation (π and Dxy). To estimate absolute nucleotide differentiation, we used our GBS reads to identify invariant nucleotide sites as well as variant ones, resulting in a dataset of 12,639,111 invariant and 374,839 variant nucleotide sites among our 45 samples in the analysis, and calculated statistics in windows across each chromosome. We show results first for a single chromosome (Fig. 3), and then for the entire genome (Fig. 4).

Each graph shows per-nucleotide statistics for 647,363 nucleotides, 24,764 of which are variable among a dataset of 15 viridanus, 15 trochiloides, and 15 plumbeitarsus, and colored lines show windowed averages (5000 nucleotide sites per window; averages for Dxy and π are multiplied 100, to better use the vertical axis). The top three graphs show FST (only defined for variable markers) between trochiloides and viridanus (top, green), trochiloides and plumbeitarsus (middle, orange), and viridanus and plumbeitarsus (bottom, purple). The middle three graphs show Dxy, using the same population comparisons as above. The lower three graphs show π within viridanus (top, blue), plumbeitarsus (middle, red), and trochiloides (bottom, yellow). Note that a small amount of jittering (2.5% of each vertical axis) was added to individual nucleotide statistics (i.e., the black dots).

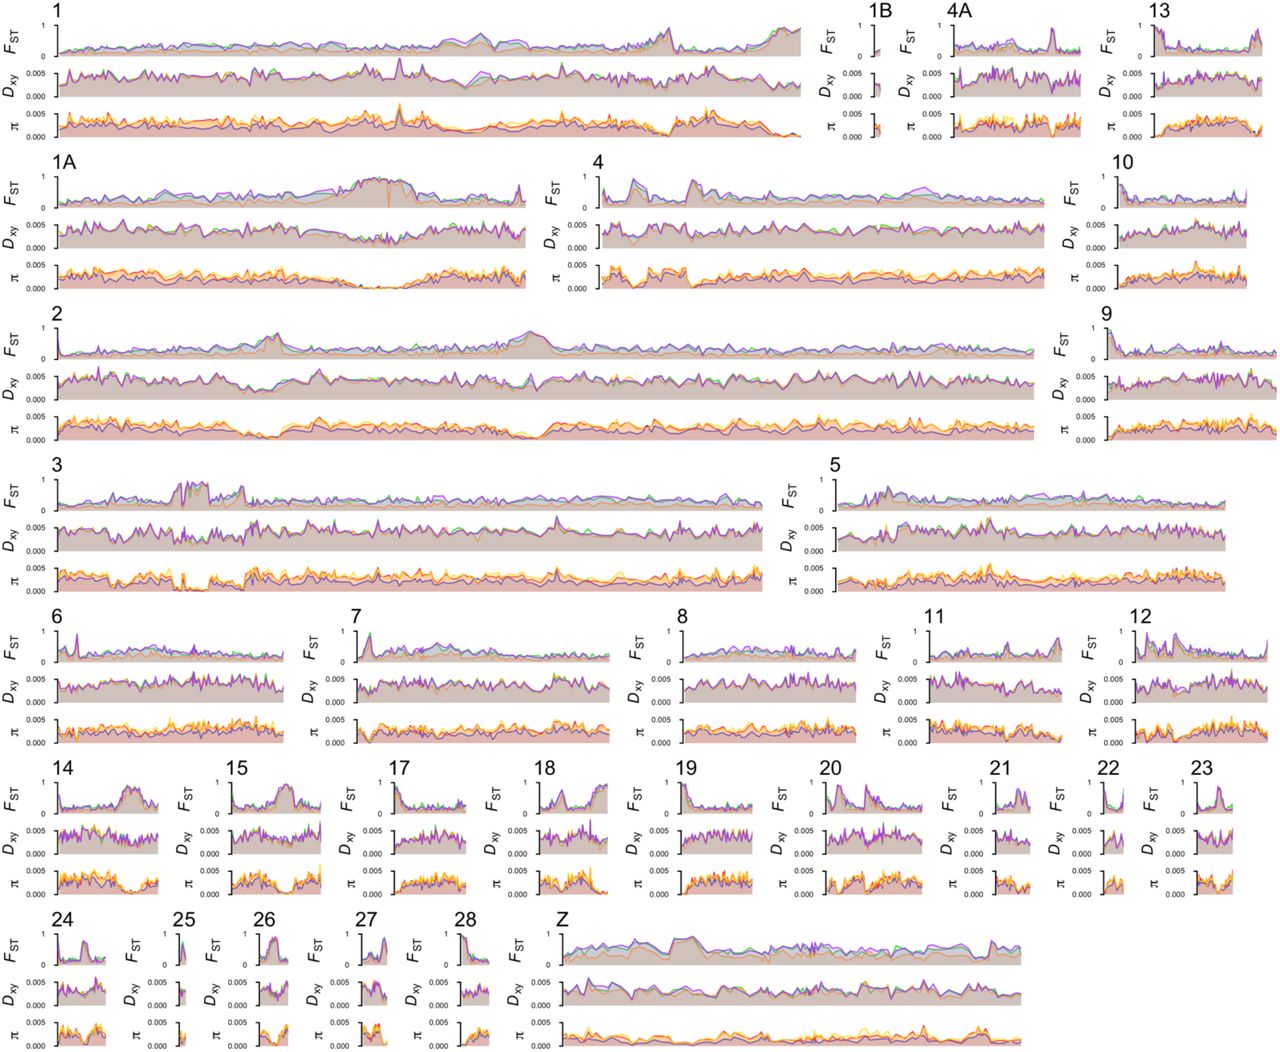
For each chromosome, graphs show variation in per-window relative nucleotide differentiation (FST, top), absolute nucleotide differentiation (Dxy, middle), and within-group nucleotide variation (π, bottom), using the same colors (3 often overlapping lines for each small plot) for particular population comparisons (for FST and Dxy) and populations (for π) as in Figs. 1 and 3.
Relative differentiation shows tremendous variability across the genome, with most chromosomes having one to several distinct islands of high relative differentiation against a background of much lower relative differentiation. Remarkably, the locations of peaks of high relative differentiation are highly similar in all pairwise comparisons among the three taxa (Figs. 3-5; see statistical tests in caption of Fig. 5). The Z chromosome on average shows much higher levels of relative differentiation than the autosomes (e.g., mean FST among windows in the comparison of viridanus and plumbeitarsus: 0.33 for autosomes vs. 0.52 for Z chromosome; Welch’s t-test: t = −12.1, df = 115.9, P < 10−15); for this reason we focus on autosomes below, and return to the Z-chromosome later.

Each graph is a bivariate plot of FST between one pair of populations vs. FST between a second pair, with each dot representing one of 2486 windows across the autosomal genome, each consisting of 5000 nucleotide sites. Within each comparison, there is a dense low-FST cluster containing the great majority of windows, and a long string of higher-FST windows. These tend to have high FST in all three comparisons (Spearman’s rank correlations: vir to troch vs. vir to plumb: rs = 0.876, P < 10−15; troch to plumb vs troch to vir: rs = 0.697, P < 10−15; plumb to vir vs. plumb to troch: rs = 0.760, P < 10−15).
Given that certain genomic regions consistently show high relative differentiation, we initially expected that those regions would also show high absolute differentiation. Surprisingly, the opposite pattern is observed: regions of high relative differentiation usually have low absolute differentiation (Figs. 3,4,6), and this is consistent among all comparisons (Spearman’s rank correlations: trochiloides vs. viridanus: P < 9.4*10−9; trochiloides vs. plumbeitarsus: P < 10−15; viridanus vs. plumbeitarsus: P = 0.0096).

Each graph shows FST versus Dxy in a comparison of two greenish warbler populations. Each dot represents a single autosomal window containing 5000 nucleotide sites. Each population comparison shows a similar pattern of a small subset of the 2486 autosomal windows deviating strongly from the majority, having large relative differentiation (right side of graph) and low absolute variation (low on the graph). Colored lines show the cubic splines fit of Dxy to FST (with smoothing parameter equal to one). The correlation among all windows is significantly negative in each pair of populations (Spearman’s rank correlation: troch to vir, rs = −0.115, P = 9.4* 109; troch to plumb, rs = −0.239, P < 10-15; vir to plumb, rs = −0.052, P < 9.6* 103).
What then accounts for the apparent paradox of high relative differentiation (FST) where absolute differentiation (Dxy) is low? It is the remarkably low within-group nucleotide diversity (π) in these genomic regions (Fig. 7). These regions of low within-group diversity have strikingly similar locations in all three taxa (Figs. 3,4,8a). Moreover, these regions have much lower within-group diversity than would be proportional to the reduced between-group absolute differentiation alone: in Fig. 8b we show that regions with a low ratio of within-group diversity to between-group absolute differentiation, which we call “standardized nucleotide diversity,” are consistent among all three greenish warbler taxa. Hence, the regions of high relative differentiation have lower within-and between-group absolute variation than the genomic background, but the ratio of within-to between-group absolute variation is especially low. The fact that these regions are consistent among all three taxa is an indication that common processes in the different greenish warbler populations have influenced these patterns. Such a pattern is consistent with recurrent selective episodes causing reduced variation throughout the greenish warbler species in the past (explaining low between-group absolute differentiation), as well as subsequently within the three current subspecies (explaining low standardized nucleotide diversity).

This graph shows the comparison of viridanus to plumbeitarsus (15 individuals each), but all other comparisons of greenish warbler populations show similar patterns. The diagonal line shows the 1:1 relationship that would be expected if within-group variation matched between-group differentiation (i.e., with no population differentiation).

Each plot shows the relationship among autosomal windows of π of one taxon to that of another (top), or windowed within-group nucleotide variation (π) divided by the maximum between-group nucleotide differentiation (Dxy) out of all three comparisons (bottom). Each dot represents a single autosomal window. Relationships are strong and highly significant (Pearson’s correlation test, with df = 2484: troch vs. vir: r = 0.840 [top] and 0.691 [bottom]; troch vs. plumb: r = 0.907 and 0.805; vir vs. plumb: r = 0.854 and 0.732; for each, P < 10 15). This analysis is based on 15 individuals per group.
We considered how variation in mutation rates across the genome might affect these patterns. Regions with reduced mutation rates are expected to show lower between-group absolute differentiation and within-group variation, assuming all else is equal. The effect should be similar (i.e., proportional) on both between-and within-group variation, hence variation in mutation rate among genomic regions would not explain the association between high relative differentiation and low absolute differentiation.
Nevertheless, to explore whether differences in mutation rate across the genome might be partly responsible for the shared patterns of variation within and between greenish warbler populations, we compared patterns in greenish warblers with those of four other related species in the same family of Phylloscopidae. To ensure no effects of differing sample sizes on our conclusions, we conducted an analysis using just a single individual from each of nine taxa (5 greenish warbler subspecies, of which three are analyzed here; and four more distantly related species of Phylloscopidae warblers; see Methods for details and justification of why a single sample per taxon is sufficient for this analysis). This analysis identified 11,055,883 invariant and 448,392 variant nucleotide sites among the nine taxa.
We reasoned that, if areas of consistently low absolute differentiation between pairs of greenish warblers are largely explained by consistently low mutation rates in those regions over evolutionary time, then we would see a strong correlation across the genome between absolute differentiation between greenish warbler populations and absolute nucleotide differentiation between distantly related species. We see evidence for only a weak correlation. For example, absolute nucleotide differentiation between Phylloscopus fuscatus and Seicercus burkii, two of the most distantly related species in our study, shows only weak correlation with absolute differentiation between greenish warbler subspecies (e.g., compared to trochiloides-viridanus: r = 0.14, P = 4.7*10−6), explaining less than 2% of the variation (Fig. S2). In contrast, absolute differentiation between different pairs of greenish warbler populations is dramatically higher (e.g., trochiloides-viridanus compared to trochiloides-plumbeitarsus: r = 0.79, P < 10−15), explaining 62% of the variation (Fig. S2). We conclude that the strikingly similar patterns of variation across the greenish warbler genome in different populations cannot be explained as a result of phylogenetically stable differences in mutation rate across the genome.
Given the striking genomic patterns observed within the greenish warbler complex (genomic regions of consistently low within-group variation, moderately low between-population absolute nucleotide differentiation, and high relative differentiation), we asked whether another species complex within the same genus displayed similar patterns. Phylloscopus inornatus and Phylloscopus humei are sister species that were only recently recognized to be distinct species (Irwin et al. 2001a), implying they can be considered to be in the latter stages of speciation. Like the greenish warblers, these two sister species show a strong correlation among genomic regions in within-taxon diversity (Fig. 9). However, there is only a weak correlation between the two species complexes in their within-taxon diversity among genomic windows (Fig. 9), and when this within-taxon diversity is standardized by the between-taxon differentiation within each species complex (controlling for the fact that each taxon necessarily tends to have less diversity at each window than the entire species complex has at that window), the correlation is even weaker (Fig. S3), explaining only 2.2% of the variation. These results suggest that the two species complexes differ strongly in the genomic positions where factors such as low recombination rate and strong selection have caused unusually low within-group variation. Despite this difference, both complexes show similar patterns of regions of high FST having moderate or low Dxy and exceedingly low π (Fig. S4).

Based on one individual per taxon, correlations of within-group nucleotide variation (π) among autosomal windows are moderately high within each species complex (e.g., viridanus vs. plumbeitarsus: r = 0.539, P < 10 15; inornatus vs. humei: r = 0.413, P < 10 15; in each, df = 1088) but much lower between these complexes (e.g., viridanus vs. inornatus: r = 0.189, P = 3.3 * 10 10; the other three comparisons have similar correlations). Note that for inornatus, a few windows have π values that are too large to be shown on the plots.
Turning to the Z chromosome, recall from above that this chromosome shows higher average relative differentiation between greenish warbler populations than the autosomal genome does. To investigate whether this could be due in part to a higher rate of substitution on the Z chromosome, we compared absolute differentiation in the Z and the autosomes between distant species (between fuscatus and burkii; and between trochiloides and burkii). Results in both cases showed quite similar distributions of absolute differentiation in the two chromosome classes (Fig. S5); the first species pair showed no significant difference between the distribution of Dxy in the Z and autosomes (t-test; t = −1.83, df = 2283, P = 0.068), and the second rather surprisingly showed a slightly lower mean Dxy in the Z (0.0136) than in the autosomes (0.0148) (t = 3.27, df = 2283, P = 0.0011), suggesting a slightly lower substitution rate in the Z.
A graph of absolute differentiation between viridanus and plumbeitarsus vs. mean within-group variation (Fig. 10) shows that this sex chromosome shows similar patterns as other high-FST regions of the genome: Dxy and π are both significantly low compared to most of the autosomal genome (see stats in caption to Fig. 10). Despite this overall pattern, no windows on the Z chromosome reach the exceedingly low levels of π seen in some parts of the autosomal genome (Fig. 10).

This figure shows the comparison of viridanus to plumbeitarsus (15 individuals each), with each dot representing a single window of 5000 nucleotide sites; all other comparisons of greenish warbler populations show similar patterns. The diagonal line shows the 1:1 relationship that would be expected if within-group variation matched between-group differentiation (i.e., with no population differentiation). Histograms along each axis show that the Z-chromosome has lower Dxy and π than the rest of the genome (Welch’s t-test; Dxy: π = 5.90, df = 115.2, P = 3.7*108; π: t = 15.68, df = 124.6, P < 10-15).
Discussion
Prior knowledge regarding phenotypic variation among greenish warblers led us to expect some combination of parallel and non-parallel patterns of genomic change among greenish warbler populations. But given that even parallel phenotypic changes can in theory be brought about through different changes at the level of the genome, we began this study with the expectation that patterns of genomic differentiation would be highly idiosyncratic, with each population showing its own peculiar patterns in terms of which genome regions show reduced or inflated within-and between-group variation. In striking contrast to this expectation, regions with reduced within-group nucleotide diversity are remarkably similar in the three focal populations, and these regions are of high between-group relative differentiation between all pairs of populations. Moreover, these regions of high relative differentiation tend to have surprisingly low absolute differentiation between populations. Overall, these patterns indicate remarkable commonalities in the genomic regions that are subject to recurrent selection in diverse populations of greenish warblers.
By examining how these patterns relate to those within and between more distantly related species of warblers, we have been able to ask whether they may partially be due to factors that are structured across the genome in a relatively constant way over broad spans of evolutionary time. For instance, recombination rate and mutation rate might be expected to differ between different parts of the genome (due to structures such as centromeres and telomeres), and if those factors have a large influence on patterns of variation in within-and between-group differentiation, we would expect similar patterns between greenish warblers and outgroup species. In contrast to this expectation, we find only weak (e.g. 1-5% variation explained) or no correlation between the structure of variation in greenish warblers and those within or between outgroup species. We conclude from this that the component of variation in these factors that is relatively constant over evolutionary time explains little of the genomic structuring of differentiation in greenish warblers. However, variation in these factors that is more localized in the phylogeny (i.e., confined to just the greenish warbler complex, due to rapid change in these factors over evolutionary time) could still play an important role.
Although the location of regions of especially low within-group variation differ between the greenish warbler complex and the P. inornatus / humei complex, the relationships between within-group variation, between-group absolute differentiation, and between-group relative differentiation are remarkably similar. In both cases, regions of high relative differentiation tend to have moderate or low absolute differentiation and very low within-group variation. These similarities point to common causal processes, although the genomic locations at which those processes are focused differ in the two species complexes.
To build an understanding of what processes may lead to the observed patterns, let us postulate for a moment that mutation rate is constant across the genome. This certainly is not true, but it may be a good approximation (at least for the moment) that will lead to understanding. Making this assumption allows us to view within-and between-group absolute nucleotide differentiation as estimates of average coalescence time of pairs of individuals (to truly estimate time, we would need to know the mutation rate, but assuming the rate is constant allows us to estimate relative coalescence times). Thus, the regions of high relative divergence have very short within-group coalescence times, and moderately short between-group coalescence times. The ratio of these between-to within-group coalescence times is high, consistent with the high relative differentiation (FST). The rest of the genome (areas of low relative differentiation) have long coalescence times, both within-and between-population, and the ratio between them is much closer to one, implying that over much of the genome within-group common ancestors tend to be almost as old as between-group common ancestors.
Hence, under an assumption of constant mutation rates, the genomic regions of high relative divergence tend to be those where all greenish warblers share a common ancestor unusually recently, and where all individuals within a specific subspecies of greenish warbler are even more closely related. Nachman and Payseur (2012) and Cruickshank and Hahn (2014) proposed an explanation for such regions of low absolute differentiation and high relative differentiation between two taxa (which have now been observed in in a number of systems analyzed by Cruickshank and Hahn 2014, including the flycatchers studied by Burri et al. 2015; as well as the Swainson’s thrushes studied by Delmore et al. 2015): selection in the common ancestral taxon reducing variation in those regions of the genome, and subsequent selection in both daughter taxa reducing the within-group variation even proportionally more (Fig. 2C). Delmore et al. (2015) proposed a related explanation: that certain regions experience selective sweeps that pass between geographic races within a geographically variable species complex, reducing variation in those regions dramatically compared to the rest of the genome, and recurrent selection in those regions then reduces within-group variation even more (Fig. 2D). We think that both models are likely applicable to greenish warblers. We feel the recent-gene-flow model of Delmore et al. (2015), which was developed in the context of two hybridizing forms of Swainson’s thrush, is particularly applicable to greenish warblers, where there is also evidence for some current gene flow throughout the whole species complex (Alcaide et al. 2014).
This chain of logic leads to a remarkable conclusion: regions of high relative differentiation could in fact have experienced more recent gene flow throughout the ring than regions of low relative differentiation (Delmore et al. 2015); areas of low differentiation may be due to shared ancestral polymorphism rather than recent gene flow. This conclusion is based on the assumption of reasonably constant mutation rates across the genome, but we feel it is robust to moderate departures from that assumption. The comparisons with other species (e.g. inornatus and humei, as discussed above) indicate that mutation rates are not consistently structured across the genome through long spans of evolutionary time, and variation in mutation rate across the genome would not explain the high relative differentiation in areas of low absolute differentiation.
Cruickshank and Hahn (2014) made the point that in a model of pure speciation-with-gene-flow, regions of high relative differentiation are expected to have high absolute differentiation. This is because genes that cause reproductive isolation prevent gene flow at that locus and at strongly linked neutral loci, whereas the rest of the genome can flow between groups, eventually resulting in lower absolute differentiation at the rest of the genome. They contrasted this model with a model of pure selection in allopatry, under which areas of high relative differentiation are due to within-population reductions in diversity rather than higher absolute differentiation. We note that our results are not actually expected under either “pure” model, and we instead argue that the results are most consistent with a combined model in which which recurrent selection, gene flow, and partial reproductive isolation likely play important roles. In this combined model, gene flow among geographically differentiated populations allows global selective sweeps to occur at specific regions where globally favorable mutations have arisen (for an example of such a sweep of a genomic region between two mosquito species, see Norris et al. 2015). This reduces the variation in that region compared to the genomic background. Subsequent mutation and selection within each population then reduce the within-group variation at those regions even more, and increase relative differentiation between populations. If the fixation of these subsequent mutations is due in part to local adaptation that differs between populations, these regions might then play a role in (partial) reproductive isolation by causing reduced fitness in hybrids. If so, regions that play a role in reproductive isolation (i.e., contain “speciation genes”) do not tend to have high absolute differentiation—this is because they in fact have a more recent common ancestor than the rest of the genome.
We call this model the “sweep-before-differentiation model” (Fig. 2D) for the formation of peaks of high relative differentiation. It is similar to the “selection in allopatry” model of Nachman and Payseur (2012) and Cruickshank and Hahn (2014) (see also Noor and Bennett 2009; Turner and Hahn 2010); in which recurrent selection in current populations as well as the common ancestor explain low within-and between-group variation at regions of high relative differentiation, but differs in that we emphasize that gene flow and reproductive isolation could also play major roles. Gene flow facilitates the spread of globally advantageous mutations, and subsequent local adaptation could lead to those regions causing low fitness in hybrids. This model is completely compatible with the idea that the effects of selection are strongest when it occurs on (multiple linked) genes in areas of low recombination (Noor and Bennett 2009; Nachman and Payseur 2012; Renaut et al. 2013; Burri et al. 2015).
This “sweep-before-differentiation model” for the formation of peaks of high relative differentiation incorporates the somewhat counterintuitive idea that all individuals within a species complex are more closely related in the differentiation peaks than they are elsewhere in the genome (Delmore et al. 2015). Because of the historical emphasis in the literature on relative differentiation (FST) being directly related to gene flow between populations (reviewed by Whitlock and McCauley 1999), such peaks have often been interpreted as regions that are more distantly related between populations compared to elsewhere in the genome. However, most of the theory relating FST to gene flow is based on assumptions of selective neutrality. When selection plays an important role, the relationship between FST and gene flow can be much more complex (Whitlock and McCauley 1999). Patterns of absolute differentiation reveal that, in fact, regions of high relative differentiation are likely areas that share a more recent common ancestor, suggesting there may have been more recent gene flow in those regions than in the rest of the genome, which may share high levels of variation due to shared ancestral polymorphism rather than recent gene flow.
Various forms of selective and neutral processes may contribute to these patterns. Within-group variation can be reduced by positive selection (e.g., selective sweeps) but also by background selection (i.e., selection against mutations with functional consequences), which reduces the effective population size and thereby tends to cause coalescence times to be shorter (Charlesworth et al. 1993). Both forms of selection could also play a role in reducing variation in some genomic regions in a common ancestral species. However, in a model of a geographically widespread species in which gene flow is somewhat restricted between populations, background selection is not expected to reduce absolute differentiation between populations, whereas selective sweeps for a universally favored variant would. Given the evidence that greenish warblers have been geographically widespread and differentiated for a long time (Irwin et al. 2001b; Alcaide et al. 2014), we feel that selective sweeps are a more likely explanation for regions of low absolute differentiation than background selection in a common (and panmictic) ancestral species. We also feel that the extremely low levels of within-group variation in some of the observed peaks of relative differentiation are best explained by selective sweeps, as sweeps have more power to reduce within-group variation to such low levels. However, quantitative modelling will be needed to test these ideas regarding the potential role of selective sweeps vs. background selection in causing regions of such low within-group variation. Regardless, it is likely that the two forms of selection often operate at the same time, given the ubiquity of the two forms of selection as well as the size of these regions of differentiation and the number of genes within them.
A large literature has discussed the commonly observed pattern of greater relative between-species differentiation in the Z chromosome than on autosomes (Charlesworth et al. 1987; Ellegren et al. 2012; reviewed by Oyler-McCance et al. 2015). We note that our results are not consistent with one of the commonly proposed explanations—that there is a higher mutation rate (and therefore substitution rate) on the Z chromosome, due to the higher proportion of time that Z chromosomes occur in males (where mutation rates have been proposed to be higher). Rather, our results indicate a similar distribution of Dxy for the Z chromosome and the autosomal genome between distant species of warbler in our analysis, and between greenish warblers a lower distribution of Dxy was observed in the Z chromosome than in autosomes. The latter observation, along with the very low within-group variation at the Z chromosome (and concomitant high relative differentiation) is consistent with the well-known hypothesis (Charlesworth et al. 1987; Ellegren et al. 2012; Oyler-McCance et al. 2015) that the Z chromosome is particularly prone to recurrent selective episodes. In this respect, the entire Z chromosome displays similar characteristics of differentiation as the “islands of relative differentiation” in the autosomal genome. The lower effective population size of the Z compared to autosomes (Charlesworth et al. 1987) can also contribute to these patterns.
We note that these inferences could not have been made without decomposing relative nucleotide differentiation into components of between-group absolute nucleotide differentiation and within-group nucleotide differentiation. We have followed the lead of Nachman and Payseur (2012) and Cruickshank and Hahn (2014) here, and we reiterate their call for close examination of these statistics in analyses of population differentiation and its causes. Furthermore, we emphasize that great insight can be gained from plotting the relationships between these variables across the genome. In particular, we suggest that researchers regularly plot the relationship (among genomic windows) between absolute differentiation and average within-group variation (Fig. 7). In the case of no selection and panmixia (that is, high migration between populations), points should be clustered near the 1:1 line (that is, variation within each group is similar to variation between). Population differentiation will move the genome away (to the right of) this line, as between-group variation becomes greater than within-group variation. If differentiation is due only to mutation and lack of gene flow (i.e., without selection), the points will move gradually away from the 1:1 line. If selection reduces within-population variation in some parts of the genome, these regions will move steadily lower on the graph, and the graph shows whether those regions have low absolute differentiation (indicating ancestral reductions in diversity of those windows) or high absolute differentiation (suggesting those parts harbor genes causing reproductive isolation, whereas the rest of the genome flows between the forms at a higher rate). The plot can also be used to examine the properties of regions of high relative differentiation, by coloring points according to FST (Fig. 7).
In conclusion, we see remarkable similarities in the genomic patterns of variation within and between three phenotypically divergent populations within the greenish warbler ring species. Comparisons with outgroup species suggest these similarities are not well explained by differences in mutation rate or recombination rate across the genome (at least in terms of the components of variation in those factors that stay relatively consistent over evolutionary time). In particular, the differences observed between the greenish warbler complex and the Phylloscopus inornatus / humei complex in genomic locations of relative divergence cast doubt on the hypothesis that regions of high relative differentiation correspond to genomic structural features such as centromeres or telomeres (e.g., Ellegren et al. 2012), unless those features have largely changed location in the roughly 12 million years of evolution since these two species complexes shared a common ancestor (Johansson et al. 2007; Price 2010). We conclude that the patterns are supportive of selection impacting most strongly on the same portions of the genome within each population of greenish warblers. We note however that the evidence for selection acting on similar regions does not indicate that selection pressures are identical in the three populations; rather, it simply indicates that selection is operating on traits encoded by similar regions. Even selection on the same gene could be in differing directions in two populations (e.g. selection for larger wing bars in one place, and smaller in another) while having a similar effect in causing reduced within-group variation. Given the strong evidence for certain phenotypes typically being under selection in warbler populations (e.g. beak size and shape, wing bars, migratory route and distance, singing behavior; Richman and Price 1992; Irwin 2000; Irwin and Irwin 2005; Price 2008; Tietze et al. 2015), perhaps we should not be surprised that certain genomic regions also are consistently under more intense selection than others. The evidence that these regions have lower between-group coalescence times suggests that there have been selective sweeps in some of these regions throughout the species complex. The possibility that regions of high relative differentiation have experienced more recent gene flow than other genomic regions has received very little previous consideration, and could dramatically alter our understanding of the process of genomic differentiation during speciation. Altogether, the results of this study point to a remarkable level of repeatability of patterns of selection and genomic differentiation within a widespread and geographically variable species complex.
Materials and Methods
Sampling
We used DNA extracts obtained from blood samples of wild-caught birds. These included 135 samples broadly distributed around the greenish warbler ring; broad genomic relationships among these were previously summarized in Alcaide et al. (2014). We also included in the present study four samples of other species related to greenish warblers (Phylloscopus inornatus, Phylloscopus humei, Seicercus burkii, and Phylloscopus fuscatus). Of these, S. burkii is most closely related to greenish warblers (despite having a different genus name), and the other three are in a different clade, with P. inornatus and P. humei being sister taxa (Johansson et al. 2007; Price 2010).
Building a greenish warbler consensus reference genome
For the purpose of mapping GBS reads to a reference genome, we wished to construct a reference genome based on variation throughout the greenish warbler ring, such that our mapping of genetic variation would not be biased toward any one part of the ring. Hence we chose one individual from each of the three most divergent subspecies around the ring (viridanus, bird TL2; trochiloides, LN10; and plumbeitarsus, BK2), conducted whole-genome shotgun sequencing and de novo assembly on each, and then constructed a consensus referencing sequence based on those three individuals. Each of the three whole-genome sequencing libraries (one for each reference individual) were run within one lane of an Illumina HiSeq 2000 automated sequencer at the NextGen Sequencing Facility of the Biodiversity Research Centre (University of British Columbia, Vancouver, Canada).
We trimmed and removed duplicates from each library using Trimmomatic (version 0.32; Bolger et al. 2014), using the settings “TRAILING:3 SLIDINGWINDOW:4:10 MINLEN:30” and FastUniq (version 1.1, default settings, Xu et al. 2012), respectively. The Avian Genome Consortium (Zhang et al. 2014) recently assembled genomes for 48 birds using SOAPdenovo (version 1.05, kmer of 27, Luo et al. 2012). We used the same settings to obtain de novo assemblies for each of our three greenish warblers (k=27, d=1 and M=3; https://github.com/gigascience/paper-zhang2014/tree/master/Genome_assembly/SOAPdenovo).
Summary statistics for the resulting assemblies are presented in Table S1. The length of each assembly is similar to other avian genomes (between 1 and 1.2 Gb; Ellegren 2013). Faircloth et al. (2012) identified two sets of ultra-conserved elements (UCEs) using whole genome alignments for the chicken, anole and zebra finch. The first set included 5561 elements; the second was limited to UCEs with higher coverage and included 2560 elements. We aligned these sequences to each genome using NCBI’s blastn. Results are shown in Table SX and show that all assemblies had at least 91% of the first set and 99.5% of the second set.
To order the scaffolds in each de novo assembly and organize into putative chromosomes, we used BWA to align scaffolds to the repeat-masked version of the zebra finch genome (version 3.2.4), resulting in a high fraction of scaffolds mapping (TL2: 78.4%; LN10: 82.4%; BK2: 80.2%); given the high synteny of the avian genome between chicken and zebra finch (Warren et al. 2010; Ellegren 2013), we make the assumption that synteny is also high between zebra finch and the warblers studied here. We imported these alignments into Geneious, which was used to construct the reference sequence for each chromosome as follows. For each individual, we annotated all regions of the zebra finch reference that had no coverage in the greenish warbler sequences, and then we extracted the consensus sequence, using a consensus threshold of 0% (fewest ambiguities), and with “If no coverage call Ref” checked. This resulted in a reference genome for each individual, consisting of greenish warbler sequence where there was coverage, and zebra finch sequence where there was not coverage (but with those no-coverage regions annotated). We used the Mauve plugin (with the ProgressiveMauve algorithm on default settings, except with “Assume collinear genomes” checked; Darling et al. 2010) to align the three individual references to each other. This Mauve alignment was then extracted, and then all regions within each reference sequence that had no greenish warbler sequence coverage (that is, those annotated as a no-coverage region) were converted to missing bases. We then trimmed the ends of the alignments consisting of only missing bases, and then extracted the consensus of these three sequences (using consensus threshold of 0%, with “ignore gaps” checked, and “If no coverage call N”). This procedure resulted in a reference sequence for each chromosome consisting only of consensus greenish warbler sequence, but of similar length as the zebra finch reference chromosome.
For the great majority of chromosomal regions, the alignment steps in the above procedure appeared to work very well, but for a few small regions (Table S2) the initial alignments in the Mauve step appeared poor and too long, with many large gaps inserted in each sequence such that very little sequence in each individual actually aligned to sequence in other individuals. For these regions, an additional alignment step was added, involving re-aligning that small region with customized parameters (e.g. adjusting the “seed weight” in Mauve). In every case, a parameter set was found that resulted in a good (and much shorter) alignment.
Mapping of GBS reads and genotyping
Raw GBS reads from Alcaide et al. (2014) were re-analyzed using an entirely distinct bioinformatic pipeline. These reads were produced by paired-end Illumina sequencing of two libraries, the first containing 96 samples broadly distributed around the greenish warbler ring, and the second containing 70 samples, 65 of which (39 adults, 25 chicks, and 1 duplicate sample for control purposes) were from a single research site (Keylong; site code PA) along the southwest side of the ring (the other 5 were outgroup species for a separate study). See Alcaide et al. (2014) for details regarding library preparation and numbers of GBS reads produced (briefly, roughly 3.3 million reads per individual in the first library, and 4.5 million in the second library).
Reads were de-multiplexed according to the in-line GBS barcode using a custom Perl script that separated reads, removed barcode and adaptor sequence, and removed sequences shorter than 30 bp in length. The de-multiplexing script allowed no mismatches in barcode sequence., Reads were then trimmed for base quality using Trimmomatic-0.32 (with options TRAILING:3 SLIDINGWINDOW:4:10 MINLEN:30). We used BWA-MEM (Li and Durbin 2009) on default settings to align trimmed reads to our greenish warbler consensus genome, and the programs Picard (http://broadinstitute.github.io/picard/) and SAMtools (Li et al. 2009) were used to produce BAM files containing the alignments. The program GATK (McKenna et al. 2010) was then used to realign reads around indels (using the tools RealignerTargetCreator, followed by IndelRealigner) and then call genotypes (HaplotypeCaller, with options “–emitRefConfidence GVCF-max_alternate_alleles 2-variant_index_type LINEAR-variant_index_parameter 128000”), resulting in a GVCF file for each individual. Genotyping information from all individuals within an analysis was then combined into a single file for each chromosome using the GATK command GenotypeGVCFs, with the option “-allSites” used such that genotypes at both variant and invariant sites were retained, and the option “-L” used to specify the chromosome (data was separated by chromosome at this point, in order to reduce file size and facilitate downstream computational efficiency).
A variety of analyses limited to different sets of individuals were then performed (see below), with the GATK command SelectVariants used to choose information for each set of individuals. We then used a combination of VCFtools (Danecek et al. 2011) and custom-written scripts to apply a series of filters to determine which sites were included in the analysis: First, indels and SNPs with more than 2 alleles were removed, as we wanted to avoid the complicating effects of such variants on the calculation of differentiation statistics. Second, we removed sites with more than 40% of individuals had missing genotypes, to restrict the analysis to sites with data from a substantial portion of individuals. Third, we removed sites with MQ < 20, to avoid poorly mapped reads. Fourth, we removed sites with heterozygosity above 60%, to avoid paralogs. We converted the resulting vcf file to a matrix of genotypes of each individual at each site.
Illustration of genomic relationships around the ring
We used principal coordinates analysis (using custom scripts in R version 3.1.2, employing the “pca” command with method “svdImpute” to account for missing genotypes) to summarize and visualize genomic relationships among individuals. We first filtered out any individuals that were missing genotypes at more than 25% of the SNPs identified in the set of individuals included in a particular analysis. We centered but did not scale genotypic values, thereby ensuring that each nucleotide mismatch had equal weighting in the analysis (this means that more variable SNPs have larger influence in the analysis).
Estimation of differentiation statistics across the genome
A custom script in R (R Core Team 2014) was used to estimate summary differentiation statistics and to produce graphs of variation across the genome. First, for each nucleotide site we calculated allele frequencies for each group of individuals defined in an analysis. We used these frequencies to calculate, for each site, both within-and between-group average pairwise differentiation between two individuals. Within-group nucleotide differentiation was calculated as 2p(1-p), where p is the frequency of one of the alleles (each nucleotide had either 1 [invariant] or 2 alleles); this within-group nucleotide differentiation thus ranges from zero to 0.5. Between-group nucleotide differentiation was calculated as p1(1-p2) + p2(1-p1), where p1 is the frequency of a given allele in the first group and p2 is the frequency of that allele in the second group; this ranges from zero to one.
For sites that were variable, we estimated nucleotide-specific FST according to Weir and Cockerham’s (1984) equation for  (top of their page 1363). This method assumes random mating within populations, and corrects for two types of sampling bias due to limited sample size: that due to limited sample size of individuals within groups, and that due to sampling a limited number of populations out of all possible replicate populations (both real and imagined, under the same evolutionary parameters that the real sampled populations evolved). We used this method to estimate FST for each nucleotide for each pair of populations included in an analysis, and also to estimate FST among all groups in an analysis. For sample sizes, we actually used the numbers of individuals successfully genotyped at that specific nucleotide site in that specific population.
Given our focus on patterns of differentiation across the genome rather than at individual nucleotide sites, we also calculated averages of these statistics on windows across each chromosome. In order to ensure that summary statistics for each window were not influenced by sample size of nucleotide sites within each window, windows were defined based on a fixed number of sites (5000 or 10,000 nucleotides depending on the analysis; see next section) for which we had good genotypic information (that is, they survived the filtering process described above), rather than a fixed window size across the reference genome. Windows were aligned starting from the side of each chromosome corresponding to the beginning side of that chromosome in the zebra finch genome (i.e., the left side in figures), and summary statistics were not calculated for incomplete window fragments on the other (right) side.
For each window, we calculated mean within-group nucleotide differentiation (π) for each group, and mean between-group nucleotide differentiation (Dxy) for each pair of groups; these statistics incorporate information from both variant and invariant sites. We also estimated multilocus FST for each window by summing the numerators of the  equation across sites and then dividing by the sum of the denominators of the same equation across sites (Weir and Cockerham 1984).
Groups in each analysis
Our analysis focused on two major analyses of differentiation within and between populations. In the first, we included 15 individuals from each of the three major greenish warbler taxa (viridanus, trochiloides, plumbeitarsus; Table S3). Individuals were chosen for inclusion in these groups prior to examining the genotypic data, and were based on choosing individuals with both high sequence coverage and that well represent the core population of that taxon (i.e., far from known hybrid zones, and avoiding those individuals identified by Alcaide et al. [2014] as having some chromosome fragments from other taxa). We view this sampling procedure as appropriate because we wanted our analysis to represent differentiation between the core populations of each taxon.
In the second analysis, we included one individual from each of nine taxa (five greenish warblers, of which three are analyzed here; and four outgroup species; Table S4). While this is certainly a small sample of each taxon, note (i) that each individual is diploid and thus contains one of each chromosome from each parent, meaning the sample size of chromosomes of each taxon is two, and (ii) a windowed analysis summarizes patterns at thousands of nucleotides in each window, reducing the impact of sampling error on windowed averages. However, because of the increased sampling error compared to the 15-individual-per-taxon analysis above, and because heterozygosity of individuals tends to be underestimated using low-coverage sequencing data, the magnitude of differentiation statistics should not be compared directly between the two analyses. Nevertheless, overall patterns of variation within and among greenish warbler populations were very similar across chromosomes in the two analyses, indicating that our comparisons with outgroup species are also valid, and data from one individual per taxon was sufficient to recover strong correlations in within-group variation observed across the genome between viridanus, trochiloides, and viridanus using larger sample sizes (Fig. S2).
Window size was set at 5000 nucleotide sites in the first (45-sample) analysis (corresponding to an average of 144 SNPs per window), and 10,000 in the second (9-sample) analysis (due to the greater influence of noise in the second).
Acknowledgements
This research was supported by NSERC discovery grant (no. 311931) and a Marie Curie International Outgoing Fellowship within the 7th European Community Framework Programme (project no. 273773). Assistance in the field was provided by Z. Benowitz-Fredericks, J. Gibson, S. Gross, G. Kelberg, A. Knorre, K. Marchetti and B. Sheldon. For additional samples we thank P. Alström, K. Marchetti, U. Olsson, T. Price, A. Richman, E. Scordato, and J. Tiainen. The study benefitted from discussions and/or comments on the manuscript from B. Harr, T. Price, L. Rieseberg, D. Schluter, D. Toews, S. Wang, and M. Whitlock.
References


