

Abstract
Understanding the causes of gene expression variation is of major importance for many areas of biology. While cis-regulatory changes have long been suggested to be particularly important for adaptation, our understanding of what determines cis-regulatory variation remains limited in most species. Here, we have investigated the prevalence, selective importance, and genomic correlates of cis-regulatory variation in the outcrossing crucifer species Capsella grandiflora. We identify genes with cis-regulatory variation through analyses of allele-specific expression (ASE) in deep transcriptome sequencing data from flower buds and leaves, and use population genomic analyses of high-coverage whole genome resequencing data from both a range-wide sample and a natural population to quantify the impact of positive and purifying selection on these genes. Our results show that in C. grandiflora, cis-regulatory variation is pervasive, affecting an average of 35% of genes within individual plants. Genes harboring cis-regulatory variation are (1) under weaker purifying selection, (2) significantly more likely to harbor nearby transposable element (TE) insertions, and (3) undergo lower rates of adaptive substitutions in comparison to other genes. Using a linear model, we identified ASE as the strongest factor contributing to purifying selection when considered alongside several other commonly used contributing factors. In turn, the main genomic correlates of cis-regulatory variation are presence of nearby TE insertions and gene expression level; notably, the signal of relaxed positive and purifying selection on genes with ASE remains after controlling for expression level. Our results suggest that variation in the intensity of selection across the genome is a major determinant of the presence of intraspecific cis-regulatory variation in this outcrossing plant species.
Introduction
Understanding the causes of regulatory variation is of major importance for many areas of biology and medicine (Albert and Kruglyak 2015). Changes in cis-regulatory elements, such as promoters or enhancers, that affect the expression of a focal gene, have long been suggested to be particularly important for adaptation (King and Wilson 1975; Carroll 2000; Wray 2007; Carroll 2008; Wittkopp and Kalay 2012; but see Hoekstra and Coyne 2007). However, in most species we still have a limited understanding of the distribution and degree of cis-regulatory variation across the genome and the relative importance of genome-scale evolutionary forces in shaping these patterns.
Due to the development of methods for high-throughput measurement of gene expression, we can now identify cis-regulatory variation on a transcriptome-wide scale. This can be done by mapping local expression quantitative trait loci (eQTL), which are likely to be enriched for cis-acting regulatory variants, or by directly identifying genes with cis-regulatory variation via analysis of allele-specific expression (ASE), because significant allele-specific differences in expression must be due to differences in linked cis-regulatory regions (Pastinen 2010; Fraser 2011). Using these methods, ample cis-regulatory variation has been identified in many species, including humans (Schadt et al. 2003; Cheung et al. 2005; Stranger et al. 2007; Veyrieras et al. 2008; Pickrell et al. 2010; Lappalainen et al. 2011; Stranger et al. 2012), mice (Doss et al. 2005; Crowley et al. 2015), Drosophila (Wittkopp et al. 2008; Massouras et al. 2012), yeast (Brem et al. 2002; Ronald et al. 2005; Skelly et al. 2011), Caenorhabditis (Rockman et al. 2010), maize (Stupar and Springer 2006), Capsella (Josephs et al 2015), and Arabidopsis (Zhang et al. 2011; Lowry et al. 2013).
While most studies thus far have focused on describing the location of variants associated with expression variation in relation to transcription start or end sites, a few have gone farther by identifying other features associated with the presence of ASE or local eQTL. In both yeast (Ronald et al. 2005), Arabidopsis (Zhang et al. 2011; Lowry et al. 2013) and Caenorhabditis (Rockman et al. 2010), genes with local eQTL are located in primarily in regions with elevated levels of polymorphism. An elegant study in C. elegans showed that this was likely because genes with cis-regulatory variation are less affected by purifying selection in the form of background selection (Rockman et al. 2010). In line with this, genes with cis-regulatory variation were predominantly located in chromosome arms with increased rates of recombination (Rockman et al. 2010). Thus, genome-wide variation in purifying selection can sometimes be more important than gene-specific selective or mutational effects for shaping cis-regulatory variation. Similar patterns have been observed in Arabidopsis thaliana (Lowry et al. 2013) and it has been suggested that cis-regulatory SNPs exhibit a signature of relaxed purifying selection in this selfing species (Zhang et al. 2011). However, in most species, we know little about the impact of positive and purifying selection on genes with empirically-identified cis-regulatory variation. Moreover, in outcrossing species, theory predicts that background selection should not have as large an impact on patterns of genomic and regulatory variation as in selfing species such as C. elegans and A. thaliana (Slotte 2014).
In this study, we have investigated the genomic distribution and selective forces acting on cis-regulatory variation in the outcrossing crucifer species Capsella grandiflora. This species is an obligate outcrosser with a sporophytic self-incompatibility system similar to that of Arabidopsis lyrata (Guo et al. 2009) and is well suited as a model for studying differences in the impact of selection across the genome, as it has relatively low population structure (St Onge et al. 2011) and a large, relatively stable effective population size (Foxe et al. 2009; Slotte et al. 2013). Indeed, selection on both protein-coding (Slotte et al. 2010) and regulatory regions (Williamson et al. 2014) is highly efficient in C. grandiflora, and high levels of polymorphism further enhance the power to detect cis-regulatory variation and to quantify the impact of selection. Genomic studies are facilitated by the close relationship (split time estimated to <200 kya; Slotte et al 2013) between C. grandiflora and the selfing species Capsella rubella, for which a genome sequence is available (Slotte et al. 2013).
To investigate the prevalence, genomic correlates and selective importance of cis-regulatory variation in C. grandiflora, we conducted deep transcriptome sequencing of mRNA from flower buds and leaves, and identified genes with cis-regulatory variation based on analyses of ASE. We further obtained high coverage whole genome resequencing data for both population and species-wide samples, to quantify the impact of both positive and purifying selection on genes that harbor cis-regulatory variation. Finally, we conduct linear modelling to identify genomic predictors of cis-regulatory variation and purifying selection. Our results show that in C. grandiflora, cis-regulatory variation is pervasive, and genes that harbor standing cis-regulatory variation are under weaker purifying selection and experience less frequent positive selection. Thus, variation in the impact of positive and purifying selection across the genome appears to be a major determinant of the presence of intraspecific cis-regulatory variation in the outcrosser C. grandiflora.
Results
Identification and phasing of SNPs for analysis of ASE
In order to identify genes with cis-regulatory variation within C. grandiflora, we generated deep whole transcriptome RNAseq data from flower buds and leaves of three C. grandiflora F1s resulting from crosses of outbred C. grandiflora individuals (total 93.5 Gbp having Q≥30, with 43.1 Gbp for flower buds and 50.4 Gbp for leaves, respectively; Supplementary Table S1). To account for read mapping biases and technical variation in analyses of ASE, we further conducted deep whole genome resequencing of all F1s (mean expected coverage per individual of 40x, total 26.6 Gbp with Q≥30; Supplementary Table S2).
We used a previously established bioinformatic pipeline to identify reliable SNPs for analyses of ASE (Steige et al. 2015). Briefly, we relied on best-practice procedures for variant calling in GATK, coupled with stringent filtering of genomic regions where we had low confidence in our SNP calls (mainly pericentromeric regions; see (Steige et al. 2015) and Methods for details). Using this procedure, we identified an average of 235,719 heterozygous coding SNPs in 17,973 genes in each F1. We then conducted read-backed phasing of genomic SNPs in GATK. This resulted in a mean number of 31,313 contiguous phased fragments per F1, with an average of 8 phased SNPs per fragment (Table 1). We empirically validated this procedure by assessing the proportion of correctly read-back phased SNPs in genomic data for three interspecific C. grandiflora x C. rubella F1s with known haplotypes genome-wide (inferred through phasing by transmission using genomic data of F1s and their highly homozygous C. rubella parents in Steige et al 2015) (see Methods for details). We found that for most genes, the vast majority of SNPs (over 95%) were correctly phased in the interspecific F1s (Figure 1). We therefore proceeded to use the longest contiguous read-phased fragment per gene harboring at least 3 heterozygous SNPs for all subsequent analyses of ASE in C. grandiflora F1s. After removing genes which were not detectably expressed, we retained ~14,000 genes for analyses of ASE in flower buds, and ~13,400 genes for analyses of ASE in leaves (Table 1).

Success of read-back phasing. The distribution of the proportion of correctly read-back phased SNPs for three interspecific F1s (inter3.1, inter4.1 and inter5.1) with known haplotypes.
Genes amenable to analysis of ASE in flower buds and leaves and ASE results.
ASE results show widespread cis-regulatory variation in C. grandiflora
We assessed ASE with a Bayesian method that uses genomic reads to account for technical variation in allelic counts and that has a reduced false positive rate compared to the standard binomial test (Skelly et al. 2011). The method requires phased data, and yields direct estimates of the proportion of genes with ASE independent of significance cutoffs, as well as gene-level estimates of the posterior probability of ASE, the magnitude of ASE, and the degree of variability in ASE along a gene.
Using the Skelly et al (2011) method, a mean of 35% (range 26%-39%) of analyzed genes showed ASE (posterior probability of ASE ≥ 0.95) in each of our C. grandiflora F1s (Table 1). Similar proportions of genes had evidence for ASE in both leaves and flower buds, and all posterior probability distributions for ASE showed a clear separation between genes with high vs. low posterior probability of ASE (Table 1; Figure 2; Figure 3). Allelic expression biases were moderate for most genes with ASE (Figure 2; Figure 3), with strong strong allelic expression biases (0.2 ≤ ASE ratio ≥ 0.8) shown by an average of just 5.1% of genes. There was little evidence for strong variability in ASE along genes (Figure 2; Figure 3).

ASE in flower buds of three intraspecific C. grandiflora F1s. Distributions of the deviation from equal expression for all assayed genes (A-C) and for genes with at least 0.95 posterior probability of ASE (D-F), estimates of the dispersion parameter (G-I), and the posterior probability of ASE (J-L). All distributions are shown for each of the three intraspecific F1s intra6.3 (left), intra7.2 (middle) and intra8.2 (right).

ASE in leaves of three intraspecific C. grandiflora F1s. Distributions of the deviation from equal expression for all assayed genes (A-C) and for genes with at least 0.95 posterior probability of ASE (D-F), estimates of the dispersion parameter (G-I), and the posterior probability of ASE (J-L). All distributions are shown for each of the three intraspecific F1s intra6.3 (left), intra7.2 (middle) and intra8.2 (right).
While a relatively large proportion of genes showed ASE in individual F1s, most cases of ASE were unique to a particular genotype or sample. Indeed, out of a total of 11,532 genes that were amenable to analysis of ASE in all F1s, only 294 genes had ASE in both leaves and flower buds of all F1s. In total, 1,010 genes showed ASE in either leaves or flower buds, 312 genes showed ASE in flower buds but not leaves, and 404 genes showed ASE in leaf samples but not flower buds of all F1s.
Elevated polymorphism at genes with standing cis-regulatory variation
In order to assess the impact of selection on genes showing cis-regulatory variation in C. grandiflora, we sequenced the genomes of 21 individuals from one population in the Zagory region of Greece (hereafter called the ‘population sample’) as well as 12 individuals from separate populations across the species range (hereafter called the ‘range-wide sample’) using paired-end 100 bp Illumina reads and a mean coverage 25x per individual (Supplementary Table S2). We called variants using GATK best practices and filtered genomic regions as previously described (Steige et al. 2015) to identify a total of 6,492,075 high-quality SNPs, most of which (5,240,485) were also segregating in the population sample.
We compared levels of polymorphism at genes that show ASE in all of our F1s (1,010 genes; hereafter ‘ASE genes’), using as a control set the 10,552 genes that were amenable to ASE analyses in all F1s but did not show significant ASE (hereafter termed “control”). To reduce bias resulting from the requirement of expressed polymorphisms from analyses of ASE, all population genetic analyses were conducted only on these paired gene sets, and genes that were not amenable to analysis of ASE were not included. ASE genes had elevated polymorphism levels compared to the control at all investigated site classes, as well as an elevated ratio of nonsynonymous to synonymous polymorphism (Table 2; Supplementary Table S3). Control genes without ASE had elevated levels of low frequency polymorphisms at nonsynonymous sites, 5’-UTRs, 3’-UTRs, introns and regions 500 bp upstream of the TSS than those with ASE, suggesting that the impact of purifying selection might differ between ASE and control gene sets (Table 2; Supplementary Table S3).
Population genetic summary statistics for the different site classes, separately for ASE and control genes. Estimates are based on the C. grandiflora population sample.
Reduced intensity of purifying selection on genes with cis-regulatory variation
To quantify the impact of purifying selection on ASE genes and control genes, we used the DFE-alpha method (Keightley and Eyre-Walker 2007). Briefly, this method allows estimation of a gamma-distribution of negative fitness effects based on site frequency spectra (SFS) at two classes of sites, one that is assumed to evolve neutrally, and one that is assumed to be subject to selection. Using this method, we found that ASE genes have a significantly higher proportion of nearly neutral nonsynonymous mutations than control genes, as well as a significantly reduced proportion of nonsynonymous mutations under strong purifying selection (strength of purifying selection Nes> 10) (Figure 4). This result applies broadly, both for the population and the range-wide samples, and when assuming a constant population size as well as after correcting for population size change (Figure 4). The result also holds after controlling for differences in the expression level among genes with and without ASE (Figure 4). There were no significant differences in the DFE depending on ASE status at 5’-UTRs (Supplementary Figures S1-S4, Supplementary Table S4). Promoter regions 500 bp upstream of the TSS and and 3’-UTRs showed significantly relaxed purifying selection in ASE genes, but this result held only under the 1-epoch model (Supplementary Figures S1-S4, Supplementary Table S4) and could in part be due to a lack of power, as regulatory motifs are expected to make up a small fraction of the analyzed sites. Consistent with this, we infer weaker purifying selection on upstream regions and UTRs than on nonsynonymous mutations (Supplementary Figures S1-S4; Supplementary Table S4).

Relaxed purifying selection on genes with ASE in C. grandiflora. The estimated proportion of new nonsynonymous mutations in each bin of the distribution of negative fitness effects is shown, with whiskers corresponding to 95% confidence intervals based on 200 bootstrap replicates, separately for genes with ASE and control genes. Panels A, C, and D show estimates for the population sample, under the (A) two-epoch model, (C) one-epoch model, and (D) two-epoch model, after controlling for expression level differences among ASE and control genes, whereas (B) shows that estimates for the species-wide sample are similar to those for the population sample. Significance levels of the p-value: * ≤ 0.05; ** ≤ 0.01.
As many other factors than cis-regulatory variation could be associated with variation in positive and purifying selection, we sought to identify factors influencing purifying selection through a general linear model, using the ratio of nonsynonymous to synonymous nucleotide diversity (πN/πS) as a proxy for strength of purifying selection. Our model used πN/πS as the response variable and several predictors: the presence/absence of ASE as a binary variable; tissue specificity (τ); gene density; gene length; expression level; map-based recombination rate; and divergence at four-fold synonymous sites (dS) as a proxy for mutation rate (see Methods for details). Model selection by stepwise AIC indicated that the best-fitting model (AIC: 17564) was the one that included all predictors. In this model, ASE had the strongest effect on πN/πS (Table 3). The presence of ASE was positively correlated with πN/πS, suggesting weaker purifying selection on genes with cis-regulatory variation. Tissue specificity showed the same trend, whereas dS, recombination rate, expression level and gene length were negatively correlated with πN/πS (Table 3).
Results of the best-fitting general linear model predicting πN/πS from genomic features. Coefficient of the regression and their standard error (SE), z statistics and associated P-value are shown.
Reduced adaptive evolution at genes with cis-regulatory variation
To investigate the impact of positive selection on genes with and without ASE we obtained estimates of ωα, the rate of adaptive substitutions relative to neutral divergence (Gossmann et al. 2010) in DFE-alpha (Eyre-Walker and Keightley 2009). For this purpose, we relied on genome-wide divergence between Capsella and Arabidopsis, with 4-fold synonymous sites considered to be evolving mainly neutrally (see Methods for details). Using this method, we find that ASE genes show a significantly lower proportion of adaptive nonsynonymous substitutions than control genes (Figure 5). In contrast, we found no significant differences in ωα among ASE genes or control genes for UTRs or regions 500 bp upstream of the TSS (Supplementary Table S3). Second, we estimated α, the proportion of adaptive fixations in the selected site class, based on the approximate method of Messer and Petrov (2013) which was designed to yield accurate estimates in the presence of linked selection. Results generated with this method were consistent with DFA-alpha, with a significantly lower estimate of the proportion of adaptive nonsynonymous substitutions at genes with cis-regulatory variation than at control genes in C. grandiflora (Figure 5).
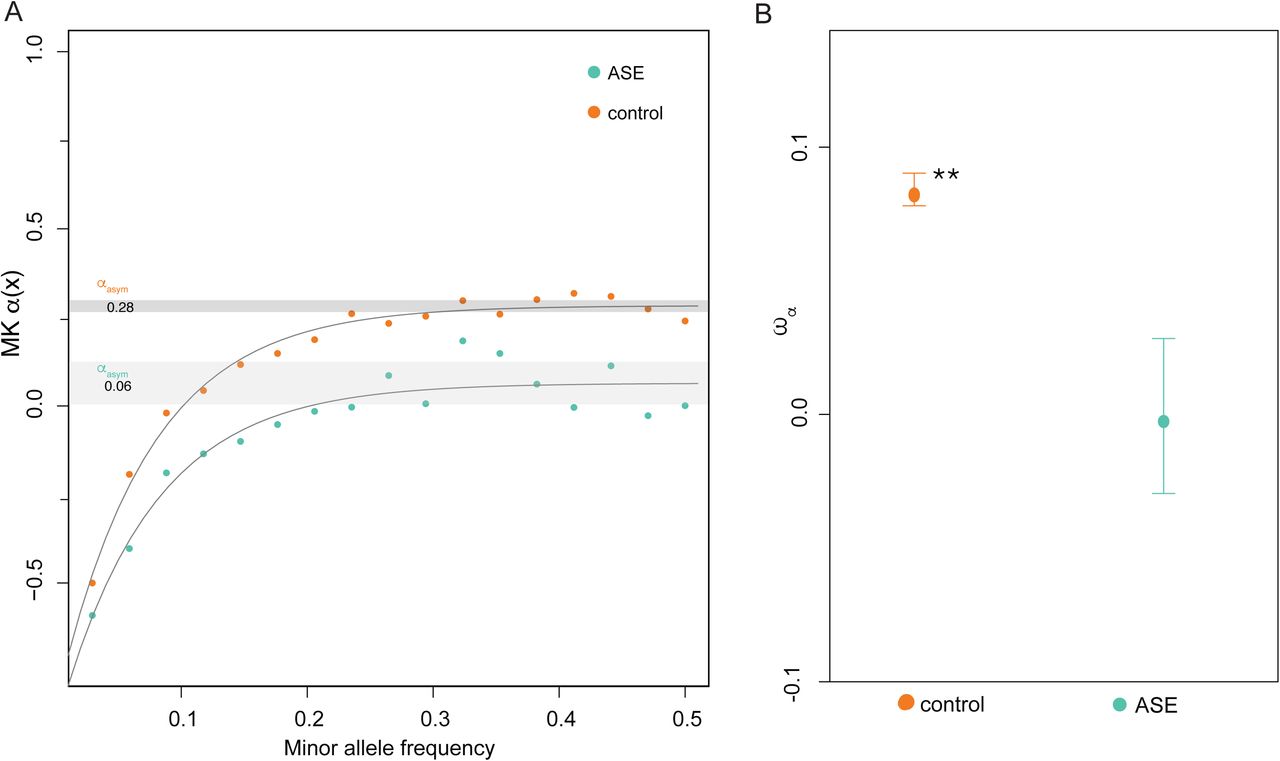
A lower proportion of adaptive nonsynonymous fixations at genes with ASE. (A) The estimated proportion of adaptive fixations relative to 4-fold synonymous substitutions (wa) for genes with and without ASE. Whiskers correspond to 95% confidence intervals based on 200 bootstrap replicates. (B) Estimation of a using the asymptotic method of Messer and Petrov (2013), which fits an exponential function to estimates of a based on polymorphisms at different frequencies. Orange dots show values for control genes, and green dots show values for genes with ASE. The grey shaded area indicates 95% confidence intervals based on 200 bootstrap replicates. The point estimate (aasym) for genes with and without ASE is 0.06 vs 0.28, respectively. Significance levels of the p-value: * ≤ 0.05; ** ≤ 0.01.
TE polymorphism is strongly associated with ASE
We have recently shown that TEs targeted by small RNAs are associated with ASE in interspecific C. grandiflora x C. rubella F1 hybrids (Steige et al. 2015). To assess whether there is also an enrichment of TEs near genes with cis-regulatory variation within C. grandiflora, we scored heterozygous TE insertions in our F1s as in (Ågren et al. 2014) and tested for an association between heterozygous TE insertions and ASE using Fisher exact tests. On average we detected 1,455 homozygous TE insertions and 1,181 heterozygous TE insertions per C. grandiflora F1; the majority of these were retroelements (Supplementary Table S5). There was a significant association between genes with ASE and the presence of heterozygous TE insertions within 1 kb of the gene (Figure 6; Supplementary Table S6). This was true for all F1s when considering flower bud samples, and for two out of three F1s when considering leaf samples.

Enrichment of TEs near genes with ASE in C. grandiflora F1s. Odds ratios of the association between genes with ASE and TEs, with TE insertions scored in four different window sizes (within a distance of 0 bp, 1 kb, 2 kb, 5 kb and 10 kb of each gene.
To test whether polymorphic TEs still had an impact after correcting for other genomic factors, we conducted a logistic regression with presence/absence of ASE as the response variable and a number of predictor variables in addition to polymorphic TEs (see Methods for details). To ensure independence of the TE data from the ASE data, we used TE information gained from the range-wide population sample, which is independent from the specific samples we used to score ASE. We selected the best model using a stepwise AIC procedure.
The best-fitting model (AIC: 3202) included polymorphic TE status, expression level, πN/πS, tissue specificity (τ) and promoter polymorphism as predictor variables (Table 4). The presence of polymorphic TEs was the most influential predictor based on the odds ratio; it resulted in a ~40% increase in the odds of observing ASE. The other predictors resulted in an increase of 9%-36% in the odds of observing ASE, and the second most important predictor was τ (Table 4). The presence of polymorphic TEs is thus an important feature associated with cis-regulatory variation in C. grandiflora.
Results of the best fit logistic regression model predicting ASE from genomic features. Coefficient of the regression and their standard error (SE), z statistics and associated p-values, and odds ratios (OR) are shown.
Discussion
It has long been hypothesized that cis-regulatory variation is an important contributor to adaptive evolution, yet the selective forces and genomic correlates of standing cis-regulatory variation remain poorly understood in most species. Here, we have shown that there is pervasive cis-regulatory variation (via its proxy, ASE) in the outcrossing plant species Capsella grandiflora, and that genes with cis-regulatory variation are under weaker purifying selection and have undergone a lower proportion of adaptive substitutions than control genes. We found that presence or absence of ASE is a strong predictor of the intensity of purifying selection as measured by the ratio of nonsynonymous to synonymous polymorphism, and ASE is indeed the best predictor when considered alongside several other widely used predictors of purifying selection (Table 3).
The impact of selection on standing cis-regulatory variation remains poorly characterized in most systems. Several recent studies have found evidence for a contribution of positive selection to cis-regulatory divergence between closely related species (Wittkopp et al. 2008; Fraser et al. 2010; Graze et al. 2012). Our results suggest that, at least for our outcrossing plant species, intraspecific cis-regulatory variation is under relaxed positive as well as purifying selection. This finding does not necessarily contradict important contributions of cis-regulatory variation to adaptive interspecific evolution. In contrast, it is possible that recurrent sweeps have removed variation specifically at genes without ASE. Supporting this scenario, recent work with the present plant species suggests a general role for recurrent hitchhiking in shaping the distribution of genomic variation (Williamson et al. 2014). In contrast with results for the selfer C. elegans, where background selection seems to shape cis-regulatory variation (Rockman et al 2010), we find no clear evidence for clustering of genes with cis-regulatory variation in certain chromosomal regions (Supplementary Figures S6-S11).
If our results for C. grandiflora hold more generally, this has implications for theoretical modeling of adaptation from cis-regulatory variation. For instance, if most standing cis-regulatory variation in natural populations is weakly deleterious, models of adaptation from initially weakly deleterious standing variation (e.g. Glémin and Ronfort 2013) would be especially relevant for an improved understanding of the contribution of cis-regulatory variation to adaptation. One specific case in which this could be useful would be to aid in our understanding the contribution of cis-regulatory changes to the recent adaptive evolution of floral and reproductive traits accompanying the recent shift to selfing in the C. rubella (Steige et al. 2015).
Our robust finding of relaxed purifying selection on genes with cis-regulatory variation is in good agreement with the results of a recent eQTL mapping study which analyzed 99 individuals from a natural C. grandiflora population and found that SNPs associated with expression variation were skewed towards low frequencies, as expected under weak purifying selection (Josephs et al 2015). Our results hold after correction for expression level variation, under different demographic model assumptions, and regardless of whether analyses are conducted on a population sample or a range-wide sample of C. grandiflora. Furthermore, our results also hold if we classify genes as ASE or control genes based on a single F1 individual (Supplementary Figure S12). Although many factors have been shown to be correlated with patterns of selection in the genome, when we considered cis-regulatory variation (via its proxy, the presence/absence of ASE) alongside several of these factors, we found ASE was the predictor with the largest effect on πN/πS. This suggests that, even after accounting for other confounding factors, cis-regulatory variation is associated with relaxed purifying selection.
It has recently been suggested that in humans, deleterious nonsynonymous variants can accumulate on the same haplotypes as regulatory variants that result in lower expression, due to their lower penetrance in this regulatory context (Lappalainen et al. 2011). This model seems unlikely to explain our results, as regulatory and coding SNPs are not expected to remain in strong LD in C. grandiflora (r2 decays to less than 0.1 within approximately 500 bp; Supplementary Figure S5). Instead, we suggest that variation in the impact of selection across the genome is more important, and that genes that are generally under weaker selection in C. grandiflora are more likely to harbor both cis-regulatory and nonsynonymous variation.
A number of recent studies have suggested that TEs may be important for cis-regulatory variation and divergence in plants (Hollister and Gaut 2009; Hollister et al. 2011; Wang et al. 2013; Steige et al. 2015). Our results provide tentative support for this conclusion, as we found an enrichment of polymorphic TE insertions in the vicinity of genes with cis-regulatory variation, and in our logistic model with presence/absence of ASE as the response, the presence of nearby polymorphic TEs was the strongest factor affecting ASE. These results suggest the importance of TEs in creating ASE under at least some conditions, for instance through effects of TEs silencing on the expression of nearby genes (e.g. Lippman et al. 2004; Hollister and Gaut 2009; Ahmed et al 2011). However, with the currently available data, we cannot rule out the alternative hypothesis that TE insertions have been able to accumulate specifically near genes that are under weaker purifying selection and are also more likely to tolerate nonsynonymous or cis-regulatory variation.
In sum, our results suggest that most common standing cis-regulatory variation in C. grandiflora is under weak purifying selection. Future empirical studies should investigate the impact of TE silencing on cis-regulatory variation in C. grandiflora, as well as how selection might jointly affect cis-regulatory variation and TE accumulation.
Material and Methods
Plant material
For analyses of ASE, we generated three intraspecific C. grandiflora F1s by crossing six individuals sampled across the range of C. grandiflora (Supplementary Table S7). For validation of our bioinformatic procedures, we also used data from three interspecific F1 individuals from C. grandiflora x C. rubella F1s that have previously been described (Steige et al. 2015).
For population genomic analyses of C. grandiflora, we grew a single offspring from field-collected seeds of each of 32 plants, representing 21 plants from one population near the village of Koukouli in the Zagory region, Greece (the ‘population sample’), and 11 additional plants from throughout the species’ range representing each of 11 additional Greek populations. Together with an individual from the Koukouli population, these represent a 12-plant ‘range-wide sample’. Collectively the 32 plants are termed the ‘population genomic sample’. Geographical origins of all samples are given in Supplementary Table S8.
Seeds were surface-sterilized, stratified at 4°C for a week, and germinated on 0.5 x Murashige-Skoog medium. One-week old seedlings were transplanted to pots in soil, which were placed in a growth chamber under long-day conditions (16 h light: 8 h dark; 20° C: 14° C). We collected leaf and mixed stage flower bud samples for RNA sequencing, and leaf samples for whole genome sequencing from all F1 plants, as previously described (Steige et al. 2015). For population genomic analyses, we collected leaf samples for whole genome sequencing from all 32 C. grandiflora plants.
Sample preparation and sequencing
We extracted total RNA from all flower bud and leaf samples of the intraspecific F1s using a Qiagen RNEasy Plant Mini Kit (Qiagen, Hilden, Germany). RNAseq libraries were constructed using the TruSeq RNA v2 kit. For genomic resequencing, we extracted predominantly nuclear DNA using a modified CTAB extraction method. Whole genome sequencing libraries with an insert size of 300–400 bp were prepared using the TruSeq DNA v2 protocol. Sequencing of 100bp paired-end reads was performed on an Illumina HiSeq 2000 instrument (Illumina, San Diego, CA, USA) at the Uppsala SNP&SEQ Technology Platform, Uppsala University. In total, we obtained 93.6 Gbp (Q≥30) of RNAseq data, with an average of 15.6 Gbp per sample from intraspecific F1s. In addition we obtained 26.6 Gbp (Q≥30) of DNAseq data, corresponding to a mean expected coverage per individual of 39x for the intraspecific F1s. For population genomic analyses of C. grandiflora samples, we obtained a total of 233.2 Gbp (Q≥30) with an average of 7.3 Gbp (Q≥30) per sample. All sequence data has been submitted to the European Bioinformatics Institute (www.ebi.ac.uk), with study accession numbers: PRJEB12070 and PRJEB12072.
Sequence quality and trimming
RNA and DNA reads from the F1s were trimmed as previously described (Steige et al. 2015). For the 32 C. grandiflora individuals sequenced for population genomic analyses, we used custom Perl scripts written by DGS to detect adapters and PCR primers present in the raw reads. Adapters and low quality sequence were trimmed using CutAdapt 1.3 (Martin 2011). We analyzed genome coverage using BEDTools v.2.17.0 (Quinlan and Hall 2010) and removed potential PCR duplicates using Picard v.1.92 (http://picard.sourceforge.net).
Read mapping, variant calling and filtering
We mapped RNAseq reads from the F1s to the v1.0 reference C. rubella assembly (Slotte et al. 2013) (http://www.phytozome.net/capsella) using STAR v.2.3.0.1 (Dobin et al. 2013) with default parameters. For genomic reads from F1s, we used STAR with settings modified to avoid splitting up reads (see Steige et al. 2015). Genomic reads from the population genomic sample were mapped using BWA-MEM v.0.7.12 (Li 2013) using default parameters and the -M flag.
Variant calling was done using GATK v. 2.5-2 UnifiedGenotyper (McKenna et al. 2010) according to GATK best practices (DePristo et al. 2011; Van der Auwera et al. 2013). We conducted duplicate marking, local realignment around indels and recalibrated base quality scores using a set of 1,538,085 SNPs identified in C. grandiflora (Williamson et al. 2014) as known variants and retained only SNPs considered high quality by GATK.
Prior to further analyses, we removed previously identified regions where we have low confidence in our variant calls due to the presence of large-scale copy number variation and repeats; these mainly consist of centromeric and pericentromeric regions (Steige et al. 2015). Before analyses of ASE, we additionally removed SNPs that were in the 1% tails of a beta-binomial distribution fit to all heterozygous SNPs in each F1, as such highly biased SNPs may result in false inference of variable ASE if retained (Skelly et al. 2011). We also removed overlapping parts of genes. For population genomic analyses, we further filtered all genomic regions annotated as repeats using RepeatMasker 4.0.1 (http://www.repeatmasker.org), and removed sites with extreme coverage (DP < 15 or DP > 200) and too many missing individuals (≥20%) using VCFtools (Danecek et al. 2011). Indels and non-biallelic SNP were also pruned prior to any analysis.
Phasing
To allow for ASE analysis based on multiple phased SNPs per gene (see section ‘Analyses of allele-specific expression’ below), we conducted read-backed phasing of previously annotated genomic variants in both the intraspecific and interspecific F1s using GATK v. 2.5-2 ReadBackPhasing (-phaseQualityThresh 10). RNAseq data from all F1s were subsequently phased by reference to the phased genomic variants. Read counts for all phased fragments were obtained using Samtools mpileup and a custom software written in javascript by JR.
To assess the quality of the read phasing we compared the phased fragments, based on reads, with the phased chromosomes, based on heritage, in three interspecific C. grandiflora x C. rubella F1s included in a previous study (Steige et al. 2015). For these interspecific F1s chromosome phasing has previously been inferred by reference to whole genome sequences of their highly inbred C. rubella parents (Steige et al. 2015). As intra- and interspecific F1s harbored similar numbers of phased SNPs per gene (median of 5 SNPs per gene in both types of F1s; Supplementary Figure S13), the success of the phasing procedure in the interspecific F1s is likely to reflect the phasing success in intraspecific C. grandiflora F1s.
Analyses of allele-specific expression
Analyses of allele-specific expression were conducted using a hierarchical Bayesian method developed by Skelly et al (2011). The method requires phased data, in the form of read counts at heterozygous SNPs for both genomic and transcriptomic data. Genomic read counts are used to obtain an empirical estimate of the distribution of technical variation in read counts, which is assumed to follow a beta-binomial distribution. This distribution is subsequently used in analyses of RNAseq data where genes are assigned posterior probabilities of having ASE. The method also results in estimates of the ASE proportion and variation in ASE along the gene.
We analyzed the longest phased fragment per gene with at least three transcribed SNPs. All analyses were run in triplicate, and we checked MCMC convergence by comparing parameter estimates from independent runs with different starting points, and by assessing the mixing of chains. Runs were completed on a high-performance computing cluster at Uppsala University (UPPMAX) using the pqR version of R (http://www.pqr-project.org) for 200,000 generations or a maximum runtime of 10 days. The first 10% of each run was discarded as burn-in and parameter estimates were then obtained as described in Skelly et al (2011).
Identification of TE insertions and association with ASE
To test whether heterozygous TE insertions are associated with ASE in C. grandiflora, we used PoPoolationTE (Kofler et al. 2012) and a custom library of TE sequences based on multiple Brassicaceae species (Maumus and Quesneville 2014) to identify TEs in the genomes of our range-wide sample and the intraspecific F1s. We required a minimum of 5 reads to call a TE insertion, and followed the procedure of Ågren et al. (2014) to determine homozygosity or heterozygosity of TE insertions.
Population genomic analyses
In order to assess whether patterns of polymorphism differ among genes with vs. without ASE, we tested for a difference in median levels of polymorphism and Tajima’s D at all site classes specified above using Mann-Whitney U-tests, with Benjamini-Hochberg correction for multiple comparisons.
Estimates of nucleotide diversity (π), Watterson’s theta (θW) and Tajima’s D (DT) were obtained using custom R scripts by BL. Separate estimates were obtained for 6 classes of sites: 4-fold degenerate sites, 0-fold degenerate sites, 3’- and 5’-untranslated regions (UTRs), introns, and intergenic regions 500 bp upstream of the transcription start site (TSS). In order to assess whether species-wide patterns of polymorphism differed from those observed at the population level, we conducted separate analyses on the 12 individuals from the range-wide sample, and the 21 individuals from the population sample.
Selection on genes with ASE
To test whether there was evidence for a difference in the strength and direction of natural selection on sets of genes with and without ASE, we first estimated the distribution of fitness effects (DFE) using the method of Keightley and Eyre-Walker (2007), and the proportion of adaptive selected substitutions relative to the total number of synonymous substitutions (ωα) using the methods of Eyre-Walker and Keightley (2009) and Gossmann et al (2010). This method allows us to assess the distribution of negative fitness effects (DFE) using the site frequency spectrum (SFS) and corrects for weak purifying selection when estimating ωα. The DFE was estimated under a constant population size demographic model and under a model with stepwise change in population size between two epochs. We obtained confidence intervals for our estimates of three bins of the DFE (0<Nes<1; 1<Nes<10; 10< Nes) and for α and ωα. by resampling genes in 200 bootstrap replicates. We tested for a difference in the DFE, and ωα among sets of genes with ASE (as outlined above) and control genes as in Eyre-Walker and Keightley (2009). Separate estimates were obtained for 0-fold degenerate sites, 3’- and 5’-untranslated regions (UTRs), and regions 500 bp upstream of the TSS likely enriched for regulatory elements. We used both 4-fold degenerate sites as well as introns as the class of sites likely to harbor mainly neutrally evolving variants. For estimates of α and ωα, we relied on divergence to Arabidopsis; specifically, we generated a whole genome alignment using lastz v. 1.03.54 (Harris 2007) with chaining of C. rubella, Arabidopsis thaliana and Arabidopsis lyrata as described in (Haudry et al. 2013), and counted divergence differences and sites as in Williamson et al (2014) for the site categories outlined above. DFE-alpha analyses were run using the method developed by Peter Keightley (Method I in Eyre-Walker and Keightley 2009).
Expression level is one of the most prominent genomic features correlated with purifying selection within plant species (Paape et al. 2013; Williamson et al. 2014) and rates of protein evolution across a broad range of species (e.g. Drummond and Wilke 2008; Larracuente et al. 2008; Slotte et al. 2011). In order to assess the effect of expression level on our DFE-alpha inference, we selected genes among the control set of genes to match the distribution of expression level of ASE genes as follows. For each gene, we obtained the maximum FPKM value among tissues in each F1 individual and then took the average over the three F1s. We divided the distribution in ten bins, excluded the first and last bin to avoid including outliers with very high or low expression level, and then resampled the control genes to match the distribution of expression levels in the ASE gene set. Purifying selection and positive selection were then re-evaluated in DFE-alpha, using the resampled control gene set and the ASE set without the first and last bin, as described above.
In order to test the impact of genomic features on purifying selection we conducted general linear modeling. We used πN/πS estimated for the population sample as a proxy for intensity of purifying selection as the response variable and included a suite of genomic predictors including recombination rates, tissue specificity in A. thaliana (τ; from Slotte et al. 2011), gene length, expression level (log FPKM value), gene density in 50kb windows, synonymous divergence (dS) and presence/absence of ASE. Only genes that were amenable to ASE analysis were included in this analysis. Gene length and density were based on the annotation of C. rubella v1.0 reference genome (Slotte et al. 2013). We obtained recombination rates per 50kb windows based on 878 markers from (Slotte et al. 2012) by fitting a smooth spline. All the continuous predictors were centered and scaled prior to the regression. We first fit a full model in R and then used a stepwise AIC procedure with backward and forward selection of variables to find the best-fitting model (Table 3).
Linkage disequilibrium decay
To assess the expected LD between regulatory and coding SNPs, we assessed the decay of linkage disequilibrium for the population sample based on r2 in 2kb windows along each scaffold. The mean r2 was plotted against physical distance to assess the relative decay of linkage disequilibrium (Supplementary Figure S5). All the calculations were done in plink v. 1.90 (http://pngu.mgh.harvard.edu/purcell/plink/, Purcell et al. 2007).
Relative importance of genomic correlates for cis-regulatory variation
We assessed the relative importance of a number of genomic correlates for presence/absence of ASE using logistic regression. The set of analyzed genes was restricted to those for which we could assess ASE, and we included the following genomic features in our analyses: recombination rate, gene density, tissue specificity (τ), gene length, expression level (log FPKM values), proportion of divergence at synonymous sites (dS), π for the region 500bp upstream of the TSS and πN/πS. All of these variables were obtained as described in “Selection on genes associated with ASE” above. We conducted logistic regression using ‘glm’ in R with model selection using a stepwise AIC procedure with backward and forward selection of variables to find the best-fitting model (Table 4).
Availability of supporting data
All sequence data has been submitted to the European Bioinformatics Institute (www.ebi.ac.uk), with study accession numbers: PRJEB12070 and PRJEB12072.
Description of additional data files
Supplementary Information contains all supplementary Tables and Figures referred to in the text.
Acknowledgements
We thank Lauren McIntyre and Stephen Wright for valuable discussions, Daniel Halligan for sharing scripts for DFE-alpha analyses and Daniel Skelly for advice on ASE analyses. We thank Veronika Scholz and Michael Nowak for bioinformatic assistance, and Julia Dankanich and Cindy Canton for assistance with experiments and lab work. Sequencing was performed by the SNP&SEQ Technology Platform in Uppsala. The facility is part of the National Genomics Infrastructure (NGI) Sweden and Science for Life Laboratory. The SNP&SEQ Platform is also supported by the Swedish Research Council and the Knut and Alice Wallenberg Foundation. The computations were performed on resources provided by SNIC through Uppsala Multidisciplinary Center for Advanced Computational Science (UPPMAX) under projects b2012122 and b2012190. This study was funded by grants from the Swedish Research Council, the Nilsson-Ehle foundation, the Magnus Bergvall foundation, and the Erik Philip-Sorensen foundation to T.S.
References


