

Abstract
The recently introduced Oxford Nanopore MinION platform generates DNA sequence data in real-time. This opens immense potential to shorten the sample-to-results time and is likely to lead to enormous benefits in rapid diagnosis of bacterial infection and identification of drug resistance. However, there are very few tools available for streaming analysis of real-time sequencing data. Here, we present a framework for streaming analysis of MinION real-time sequence data, together with probabilistic streaming algorithms for species typing, strain typing and antibiotic resistance profile identification. Using three culture isolate samples as well as a mixed sample, we demonstrate that bacterial species and strain information can be obtained within 30 minutes of sequencing and using about 500 reads, initial drug-resistance profiles within two hours, and complete resistance profiles within 10 hours. We also show that our pipeline can process over 100 times more data than the current throughput of the MinION on a desktop computer.
Background
Massively parallel, short-read sequencing has profoundly transformed genomics research [1, 2] and has become the dominant technology for sequencing DNA. However, one inherent limitation of sequencing millions of sequence fragments in parallel one base at a time is that the sequencing run has to finish before the data analysis can begin. As a result, sequence analysis algorithms have been designed to make inference on a complete sequencing dataset. In contrast, streaming algorithms are a class of algorithms which are applied to a sequence of data events and typically maintain an internal summary of the data as well as an approximation to the full inference without needing to store all of the observations [3]. Streaming algorithms have application in particle and solar physics, computer network analysis and finance [4].
Oxford Nanopore Technologies has recently released a portable MinlON sequencing device, which utilizes the nanopore sequencing technology proposed in the 1990s [5]. The key innovation of this device is that it measures the changes in electrical current as a single-stranded DNA passes through the nanopore and uses the signal to determine the nucleotide sequence of the DNA strand [6, 7]. This sequence data can be retrieved and analyzed as it is generated, providing the opportunity to obtain answers in the shortest possible time. Real-time sequencing has immense potential in many applications, especially in time-critical areas such as rapid clinical diagnosis.
In order to realise this potential there is a need to develop streaming bioinformatics algorithms which continually update inference about the sample as each sequence read is generated. To be of practical use – for example to know when to when to make a diagnosis in the clinic – these algorithms must continuously update not only a point estimate (e.g. which species present and their proportions), but also confidence intervals in that estimate. Several systems incorporating real-time analysis of MinION data have been developed recently such as the cloud based platform Metrichor (Oxford Nanopore), work by Quick et al [8] and MetaPORE [9], focusing on placing the sample on a phylogenetic tree but without providing an estimate of the confidence in this assignment.
Here we present a flexible framework for real-time analysis on MinION sequence data directly off the sequencing device. The framework can incorporate multiple real-time analyses to suit the problems at hand and can be deployed on a single computer or on a high performance computing facility and computing cloud. We also present four streaming algorithms for identification and characterization of pathogen samples. These algorithms, which are seamlessly integrated into the pipeline, report analysis results along with their confidence levels so that users can decide when to stop a sequencing run.
By sequencing three bacterial isolate samples and a mixture sample on the MinION sequencer, we demonstrate that we can reliably determine the species and strain type of a sequenced sample with only 500 reads. This was achieved in less than half an hour of sequencing with the current throughput of the MinION. Furthermore, we show that we can identify the majority of the drug resistance genes present in a sample within 2 hours of sequencing, and the full drug resistance profile within 10 hours. We also show that MinION sequence data can be used for accurate Multi-Locus Sequence Typing (MLST), despite the relatively high error rates associated with the technology. The pipeline can perform all these analyses on a single computer at a throughput of over 100 times higher than our best runs. As the throughput of nanopore sequencing is expected to increase, the time to obtain these results will be significantly shortened. Our findings support the potential use of MinION sequencing for real-time analysis of clinical samples for species detection and analysis of antibiotic resistance.
Results and discussion
Real-time analysis framework
At the high level, our real-time analysis framework consists a number of streaming programs communicating to each other via the network sockets or the inter-process communication pipes provided by Unix-like operating systems. These programs typically take a sequence of items as input and process after every some small number of items arrive. They either retain only the relevant statistics of the data, or upon processing any data items, immediately forward only the necessary information to the downstream programs for further processing. The processing in such streaming fashion does not need to keep all the data in the memory and hence requires little memory and is relevant for processing large amount of data, especially streaming data from MinION sequencing.
We developed a number of auxiliary programs to facilitate the setting up a real-time pipeline, especially for analysis of MinION sequencing data. These include scripts for setting up communication channels in a pipeline, thereby allowing the pipeline to be deployed on a high performance computing cluster to scale with the massive amounts of data. Programs for simple analyses of the MinION sequencing data such as initial analysis (npReader [10]) and filtering sequence reads satisfying certain criteria (such as read length and read quality) are also provided.
We developed streaming algorithms for a handful of identification analyses, namely species typing, strain typing and identification of antibiotic resistance profiles (see Methods). We integrated the implementations of these algorithms into the analysis pipeline (see Figure 1). In this pipeline, npReader [10] continuously scans the folder containing sequencing data in parallel with the MinION sequencing. It picks up sequence reads as soon as they are generated, and simultaneously streams them through the pipeline for the identification analyses. The pipeline also makes use of off-the-shelf bioinformatics tools such as BWA-MEM [11] as described later.
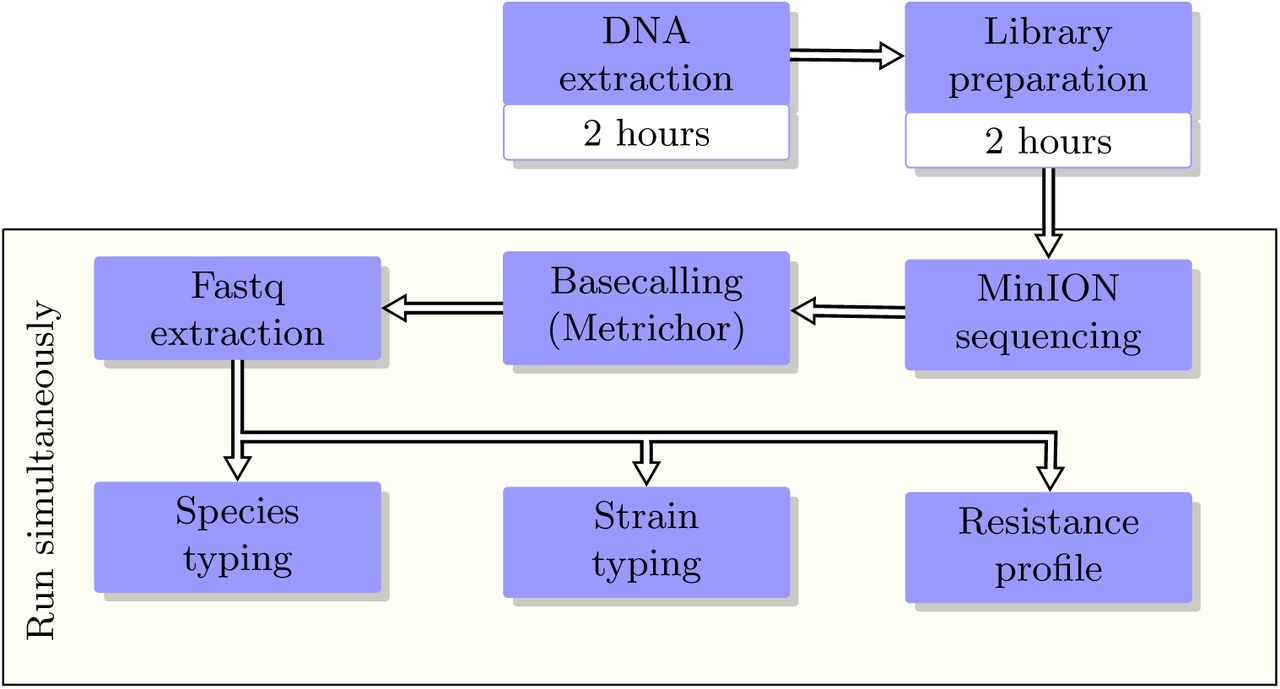
Schematic of the real-time analysis pipeline. Typically it takes at least 4 hours to go from a cultured isolate to a library for MinION sequencing. Once the MinION starts sequencing, DNA fragments are sequenced (on the MinION) and base-called (by Metrichor cloud) instantaneously, and are simultaneously streamed through the pipeline. Analysis results and their confidence levels are reported in real-time. User can stop an analysis or the whole pipeline once the desired confidence levels are obtained.
We evaluated our real-time analysis pipeline and the accuracy of our algorithms using four MinION sequencing data sets. As the pipeline was developed after we performed the MinION sequencing runs, we emulated the timing of the sequencing for the evaluation. Specifically, we extracted the time that each read was sequenced, and streamed the sequence reads in the exact order and timing into the pipeline. With the emulation, we was able to stream the sequencing data with a hypothetical throughput of 120 times higher what we obtained. This allowed us to test the scalability of the pipeline against the projected future MinION throughput. Finally, we validated the analysis results by sequencing these samples with Illumina MiSeq platform, where bioinformatics analysis methods were established.
Data generation
We prepared three samples of cultured isolates of the Klebsiella pneumoniae (K. pneumoniae) strains ATCC BAA-2146, ATCC 700603 and ATCC 13883 and a library mixture sample. This mixture sample contains two different sequencing libraries prepared from the Escherichia coli (E. coli) strain ATCC 25922 and the Staphylococcus aureus (S. aureus) strain ATCC 25923, pooled at different levels prior to sequencing (Table 1). We sequenced the K. pneumoniae samples ATCC BAA-2146 and ATCC 700603 with the MinION using chemistry R7, the others using the improved chemistry R7.3 (see Methods).
Details of the four samples.
In order to validate the analysis results from MinION sequencing, we sequenced all aforementioned isolates with the established Illumina platform MiSeq to a coverage exceeding 100-fold. Isolates in the mixture sample were sequenced separately. We assembled the MiSeq sequencing reads to obtain high quality assemblies of the five strains. With the assemblies, we were able to identify the strain types and the antibiotic resistance profiles of these strains (see Methods). These results were used as the benchmarks to validate the analysis of MinION sequencing data.
Sequencing yields and quality of MinION sequencing
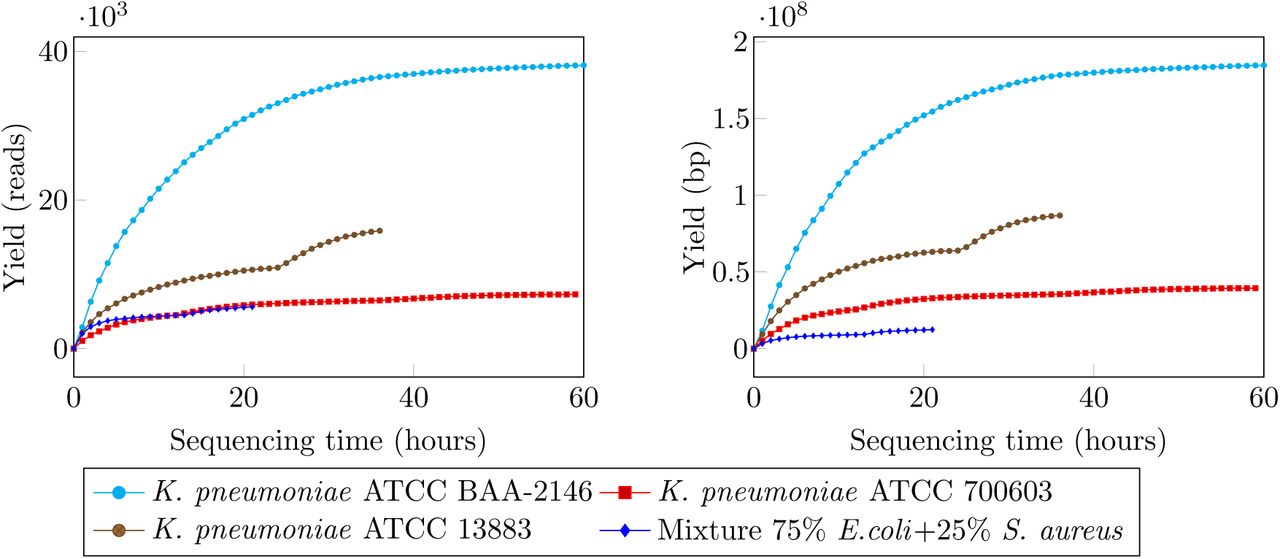
Sequence reads from the MinION were classified into three types: template, complement and higher quality 2D reads (i.e., reads resulted from computationally merging a template and a complement read). The average Phred quality of template and complement reads across four runs was in the region of 5 while 2D reads were in higher quality, with average Phred quality about 9 (see Table 2 and Figure 3). The median read lengths of three K. pneumoniae samples were approximately 5Kb, while the mixture sample was only less than 1Kb (Figure 3). We observed a variation in terms of sequence yields across the four runs. While we obtained nearly 40000 reads (185Mb) for sample K. pneumoniae ATCC BAA-2146 after 60 hours of sequencing, the run for sample K. pneumoniae ATCC 700603 yielded only 7092 reads (39Mb) with the same running time (Figure 2). We sequenced sample K. pneumoniae 13883 and the mixture sample for 36 and 20 hours respectively both with the chemistry 7.3 but and the yields were markedly different to each other. The read length and accuracy of our runs were consistent with other user reports [12–15].

Sequencing yields over time for the four samples. Yields are shown in terms of read count (left) and base count (right).
Details of the four MinION sequencing runs.
Species detection
For real-time bacterial species detection, we built a database from 2,785 complete genomes of 1,489 bacterial species available in GenBank (http://www.ncbi.nlm.nih.gov/genbank/, accessed Nov 2014). The database contained a number of K. pneumoniae, E. coli and S. aureus strains (10, 63 and 49 respectively), but none of the five strains in our samples were present. The pipeline aligns sequence reads as they are generated from the sequencer to this database. The species typing algorithm periodically computes the simultaneous proportions of the species present in the sample and reports the 95% confidence intervals of these proportions (See Methods).
In all three K. pneumoniae samples, we successfully detected K. pneumoniae as the major species present in the isolate. This was achieved with as little as 120 sequence reads requiring only 5 minutes of sequencing time (Figures 4a), b) and c)). For K. pneumoniae strains ATCC BAA-2146 and ATCC 13883, it required less than 500 reads (10 and 15 minutes of sequencing, respectively) to reach a 95% confidence interval of less then 0.05. Interestingly, we found the analysis of K. pneumoniae ATCC 700603 sample reported a mixture of about 80% K. pneumoniae and 20% K. variicolla. These proportions did not change after sequencing 500 reads (25 minutes), suggesting a stable prediction of species proportions in the sample. Application of our strain typing algorithm (see below) identified the strain of this sample as ST-489, which was confirmed from the assembly of the MiSeq sequence data for this sample. ST-489 has been reported to have been mis-classified as K. pneumoniae rather than the recently proposed new species K. quasipneumoniae [16, 17]. Despite this species being missing from our original database, our pipeline reported the sample to be a mixture of two closest species (K. pneumoniae and K. variicolla) of the sample, highlighting its ability to flag species not previously known. Finally, we selected the assemblies of two K. quasipneumoniae strains, K268An (ST-334) and DR85/08 (ST-734) from Holt et al (2015) [17] and added to our bacterial genome database. We did not include strain ST-489 in the database. The species detection pipeline correctly identified sample strain ATCC 700603 as K. quasipneumoniae using only 300 reads (Figure 4e)).
The pipeline accurately identified the two species in the mixture sample as E. coli and S. aureus after obtaining around 100 reads (5 minutes of sequencing). The reported proportions became stable after around 1200 reads (35 minutes of sequencing). E. coli was the predominant species type in the mixture sample and it was evident with high proportion of sequencing reads supporting the E. coli species.
Multi-locus Sequence Typing
K. pneumoniae and other bacteria are conventionally strain typed using a MLST system which requires accurate genotyping to distinguish the alleles of seven house-keeping genes [18]. Our analysis of MinION raw read quality (Fig. 3), together with other user reports [12–15], indicated high error rates in MinION sequencing in comparison to Illumina Miseq sequencing. This suggested that MLST typing was challenging with MinION sequence data, especially in real-time fashion.

The distribution of read quality and read length of the four MinION runs.

Real-time identification of bacterial species from MinION sequencing data for four different bacterial samples. Species typing of four samples using existing bacterial genomes from GenBank was shown in a) b) c) and d). The bars represent confidence intervals at 95% level. Sample ATCC 700603 (K. quasipneumoniae) was identified as a mixture of K. pneumoniae and K. variicola as no K. quasipneumoniae strains present in the database. Figure e) shows the species identification of this sample when two K. quasipneumoniae strains (not including this strain) were added to the database.
We developed a method to carry out MLST typing using MinION sequence data. Our method selected only reads spanning one of the house-keeping genes. It then used multiple reads aligned to the same gene to correct error in the raw sequence reads and subsequently combined information across multiple alleles in a likelihood-based framework (See Methods). Table 3 presents the top five highest score types (in log-likelihood) for three K. pneumoniae strains using MinION sequencing. In all three strains, the correct types were the highest score out of 1678 types available in the MLST database. We noticed that the typing system also outputted several other strain types with the same likelihood (e.g., types ST-751 and ST-864 for strain ATCC BaA-2146 and type ST-851 for strain ATCC 700603). We examined the profiles of these types, and found that these strain types were highly similar. For example, strain types ST-751 and ST-864 (reported for strain ATCC BAA-2146) differed to the correct strain type ST-11 by only one SNP from the total of 3012 bases in seven genes. Similarly, strain type ST-851 (co-highest score reported for strain ATCC 700603) differed to the correct strain type ST-489 by two alleles (genes phoE and tonB). There was only one read aligned to these two genes by the end of the run due to the poor yield of this run, which may have also contributed to inability to differentiate these two strain types. While the results were encouraging, this also suggested that a more accurate strain-typing methodology would need to consider all of the sequenced reads, rather than just those covering 7 house-keeping genes. Therefore we further devised a method for strain-typing which was based on presence or absence of genes.
Multi-locus strain-typing results for three K. pneumoniae strains. The top five probable MLST types are shown for each sample. The highest score strain types are highlighted.
Strain typing by presence or absence of genes
We developed a novel strain typing method to identify the bacterial strain from the MinION sequence reads based on patterns of gene presence and absence. We downloaded the genome assemblies of all strains for K. pneumoniae, E. coli and S. aureus species from Ref-Seq repository and identified their strain types using the relevant MLST schemes. This resulted in sets of 125 strain types for K. pneumoniae, 353 for E. coli and 107 for S. aureus. For each strain type, we picked the highest quality assembly (in terms of N50 statistic) and extracted gene sequences from its RefSeq gene annotation. We then grouped genes from a species based on 90% sequence identity, and therein obtained the gene profile for each strain type.
Our pipeline identified genes present in the sample from sequence reads as they were generated by the MinION device. It then used this information to infer the posterior probability of each of the strain types, as well as the 95% confidence intervals in this estimate (see Methods). For our three K. pneumoniae samples, we successfully identified the corresponding strain types from the sequence data with 95% confidence within 10 minutes of sequencing time and with as few as 200 sequencing reads (Figures 5a), b), and c)). We streamed sequence reads from the mixture sample through the strain typing systems for E. coli and S. aureus, and in both cases, the correct strain types of two species in the sample were also recovered. The correct type for E. coli strain in the 75%/ 25% E. coli, S. aureus mixture was recovered after 25 minutes of sequencing with about 1000 total reads (or approximately 750 E. coli derived reads). (Figure 5d)). The pipeline was able to correctly predict the S. aureus strain (which is known to have much less gene content variation) in this mixture sample after two hours of sequencing with about 2,800 total reads (or approximately 700 S. aureus derived reads).

Real-time identification of strain type from MinION sequencing data on three different K. pneumoniae strains and a mixture sample of an E. coli and a S. aureus strain. The bars represent confidence intervals at 95% level.
The degree of gene variation between strain is quite variable across different bacterial species, and this will impact on the time taken for our confidence intervals to converge. For example only 6% of the K. pneumoniae pangenome (N = 328) of 29,886 genes are core genes K. pneumoniae genomes [17], whereas 45% of the S. aureus pangenome (N = 10) and 20% of the E. coli pan-genome (N = 22) are core genes [19], although it is important to note that the percentage of core genes is a function of the number and diversity of strains sequenced.
Antibiotic resistance detection
The antibiotic resistance profiles of the samples were also characterized with MinION sequencing data. We obtained antibiotic drug resistance genes from ResFinder database [20] (https://cge.cbs.dtu.dk/services/ResFinder/, accessed July 2015). This set contained over 2132 gene sequences, including variants of the same genes. We grouped these gene sequences based on 90% sequence identity into 609 groups. In this grouping, we found that sequences in a group were variants of the same gene.
Our antibiotic resistance profile identification pipeline aligned sequence reads to this antibiotic gene database. The algorithms retained reads that aligned to these genes, and periodically performed multiple alignment of reads that were aligned to the same gene. It then generated a consensus sequence from these reads, and used a probabilistic Finite State Machine [21] to realign the consensus sequence to the gene sequence (see Methods). The pipeline reported the presence of a resistance gene as soon as the alignment score reached a threshold.
Table 4 shows the time-line of antibiotic genes detection from MinION sequencing of three K. pneumoniae strains. For the NDM-1 producing strain ATCC BAA-2146, we identified the presence of 26 antibiotic resistance genes in the MiSeq assembly of the strain. Our real-time pipeline identified all these 26 genes and an additional gene blaSHV from 10 hours of MinION sequencing. No further gene was detected thereafter. As gene blaSHV was reported with high confidence from the our real-time analysis, we further investigated the alignment of the MiSeq assembly with this gene, and found that the gene was actually aligned to two contigs in the assembly suggesting the MiSeq assembly might have been fragmented in the middle of the gene. We sourced a high quality assembly of the strain’s genome using PacBio sequencing [22] and found that the assembly actually contained the gene. In other words, our pipeline detected precisely the antibiotic gene profile for this strain from 10 hours of MinION sequencing. We observed that the majority of these genes were identified in early stage of sequencing, i.e., three quarters of these genes were reported within 1.5 hours of sequencing, at less than 4000 reads (making up only a 3-fold coverage of the genome). We observed similar performance for K. pneumoniae strain ATCC 13883 where 5 out of 6 genes after two hours of sequencing. The last gene (oqxB) was detected after 9.5 hours of sequencing, again recovering the full resistance profile without any false positive. For the multi-drug resistant K. pneumoniae strain ATCC 700603, the pipeline only detected 8 out of 11 genes. The reduced sensitivity for this sample was most likely due to the low sequence yield (33Mb of data in total, or only 7-fold coverage of the genome).
Timeline of resistance genes detection from the K. pneumoniae samples. TP/FP: true positives/false positives according to the resistance gene profiles obtained from MiSeq sequencing. *Gene blaSHV was detected from MinION sequencing of K. pneumoniae ATCC BAA-2146 but not from MiSeq sequencing due to the inability to resolve a repeat in the gene.
Comparison with existing methods
To date, there are only a few existing pipelines for identification of species/subspecies from nanopore sequencing data, namely Metrichor [23], [8] and MetaPORE [9]. These methods commonly place the sample of question to a phylogeny taxonomy based on the number of reads that either are aligned to or have a similar k-mer profile to the taxon’s reference genome. Our species typing method is somewhat similar to this approach, although it additionally estimates confidence intervals in the species assignment. While we found that this approach can successfully identify species within 500 reads, the signal to noise from nanopore sequencing is too low to use a similar approach to correctly discriminate at the strain level, unless a large amount of data is available. Our strain typing uses a novel approach based on the presence and absence of genes and hence is able to make inference from a smaller number of reads.
Among the mentioned methods, only Metrichor [23] and MetaPORE [9] support genuine real-time analysis. As MetaPORE only focuses on viral species identification, we could only directly compare the performance of our method to Metrichor. We uploaded the first 1000 reads from our single samples and the first 3000 reads from our mixture sample to the Metrichor What’s In My Pot Bacteria k24 for SQK-MAP005 v1.27 (WIMP) workflow. Along with the species/subspecies and strains reported, WIMP provides a classification score filter where users can set the permissiveness of reporting. Table 5 presents the bacterial taxa reported by WIMP workflow for our data with the default classification score. For sample K. pneumoniae ATCC BAA-2146, WIMP only returned the taxon K. pneumoniae at the species level. On the other hand, for the second and third samples (K. pneumoniae ATCC 700603 and K. pneumoniae ATCC 13883), WIMP reported several K. pneumoniae strains but not the correct strain types of these samples (ST489 and ST3). For the mixture sample, two E. coli and three S. aureus strains were reported, but also not the correct strain types (E. coli ST73 and S. aureus ST243). While it was unclear whether the strain types of these samples were included in WIMP’s database, ST11 clearly was as it was reported in sample K. pneumoniae ATCC 700603. However, WIMP was unable to identify sample K. pneumoniae ATCC BAA-2146 to the strain level with 1000 reads, while our pipeline could do so in less than 400 reads (Figure 5).
Report of Metrichor WIMP bacteria from the first 1000 reads of three single samples and the first 3000 reads of the mixture sample. The last column indicates if the detection is correct (✓) or incorrect (×) at species/strain levels. The Metrichor was able to identify the species (with some false positives) but not the strains in our samples.
Antibiotic resistance genes detection from MinION sequencing was also explored in Judge et al [24]. Their approach was broadly similar to ours in that it initially aligns sequence reads to a resistance gene database, and then constructs a consensus sequence from the multiple alignment of matched reads. Both pipelines reported close to perfect resistance gene identification when compared with Illumina MiSeq sequencing. However, our pipeline uses a novel alignment parameter estimation using probabilistic Finite State Machines (see Methods). It is hence able to confidently report the presence of a resistance gene as soon as sufficient supporting data are available. This is the essence of real-time analysis presented here.
Computational time
In our analyses, sequence reads were streamed through the pipeline in the exact order and timing as they were generated. Analysis results were generated periodically (every minute for species typing and strain typing and every five minutes for resistance gene identification). We examined the scalability of the pipeline to higher throughput by running the pipeline on a single computer equipped with 16 CPUs and streaming all sequence reads from the highest yield run (185Mb from sample K. pneumoniae ATCC BAA-2146) through the pipeline at 120 times higher speed than they were generated (e.g., data sequenced in 2 minutes were streamed within 1 second). Analysis results were generated every 5 seconds for typing and every one minute for gene resistance analysis. With this hypothetical throughput, our pipeline correctly identified the species and strain of the sample in less than 20 seconds, upon which we could terminate the typing analyses. The pipeline then reported all the resistance genes in five minutes, which corresponded to the data generated in the first 10 hours of actual sequencing. This demonstrates the scalability of our pipeline to higher throughput sequencing.
Discussion
In recent years HTS has become an integrative tool for infectious disease research [25, 26]. There have been several reports emphasizing the use of HTS methods to characterize clinical isolates, to study the spread of drug resistant microorganisms and to investigate outbreak of infections [27–29]. These studies predominantly use massively parallel short-read sequencing technologies such as the Illumina Miseq, NextSeq or HiSeq. These sequencers achieve a very high base calling accuracy which makes them ideally suited to applications which require accurate calling of single nucleotide polymorphisms (SNPs), including reconstructing the evolutionary history of different bacterial isolates; tracking transmissions during an outbreak; placing a new isolate on a phylogenetic tree and population genetic analyses. However, these technologies attain their high yield by sequencing a single base per cycle for millions of sequence fragments in parallel, where each cycle takes at least 5 minutes.
The Oxford Nanopore MinION device, on the other hand, generated as many as 500 reads in the first 10 minutes of sequencing in our hands (which is 3 times lower than the theoretical maximum). The error rate of these reads was substantially higher than the corresponding Illumina data. Existing bioinformatics algorithms – which have been developed for highly accurate Sanger and subsequently for short-read sequencing – rely on accurate base and SNP calling, which makes their application to MinION data challenging. As an example, most existing strain typing approaches often use a MLST system, either on a predefined set of house keeping genes [30], or on core genes set [31]. These approaches are highly standardized, reproducible and portable, and hence are routinely used in laboratories around the world. Rapid genomics diagnosis tools using MLST from high-throughput sequencing such as SRST2 [32] have also been developed. While we showed that MLST can be adapted to identify bacterial strain type from nanopore sequencing, this requires high coverage sequencing of the gene set to overcome the high error rates. Similarly, other researchers have shown that error correction can overcome the high error rate providing enough coverage is obtained [15, 33].
The main contribution of this manuscript is to demonstrate that despite the higher error rate, it is possible to return clinical actionable information, including species and strain types from as few as 500 reads. We achieved this by developing novel approaches which are less sensitive to base-calling errors and which use whatever subset of genome-wide information is observed up to a point in time, rather than a panel of pre-defined markers or genes. For example, the strain typing presence/absence approach relies only on being able to identify homology to genes and also allows for a level of incorrect gene annotation.
Our species typing module has some similarities to the approach used by MetaPhlAn [34], in that we use the proportion of reads which map to different taxonomic groupings to estimate the proportion of different species in a sample. MetaPhlan optimises computational speed by aligning to a precomputed database of sequences which are pervasive within a single taxonomic grouping but not seen outside that grouping. This allows it to blast against a database which is 20 times smaller than a full bacterial genomic database. This was designed to make metagenomics inference feasible on datasets with millions of reads. On the other hand, our species typing approach is designed to make a similar inference using only hundreds of reads, and moreover, also continuously updates confidence intervals so the user knows when they can stop sequencing and make a diagnosis.
Our antibiotic resistance module is able to identify the drug resistance potential of an isolate within a few hours of sequencing with very high specificity. In particular, with the most recent chemistry utilized in this paper (R7.3), we were able to identify the complete resistance potential of a K. pneumoniae isolate without any false positives in 9.5 hours and with approximately 8000 reads (80% of the resistance genes were identified with 3000 reads in 2 hours). In order to achieve high specificity we designed a probabilistic Finite State Machine for error correction. This approach continuously updates the consensus sequence from the multiple alignment of reads, and re-estimates the error profile of the consensus sequence. This allows the reporting of the presence of a resistance gene once sufficient accuracy is obtained, rather than waiting for the full run to complete.
In summary, we have developed an open-source, flexible pipeline for real-time analysis of MinION sequencing data. Our pipeline can be deployed on a single 16 core computer, capable of analysing MinION data streaming at up to 120x the current rate of sequencing; or on a high performance computing cluster to scale with the potential even higher throughput of forthcoming nanopore sequencing platforms. Our pipeline incorporates three streaming algorithms, but further algorithms can be flexibly integrated into this pipeline.
Other investigators have focused on the long-read nature of MinION sequencing data, which enables complete genome assembly [33] as well as the identification of sites of integration of resistance islands [13]. Researchers have also recently reported that MinION sequencing data could accurately identify bacterial outbreak strains within 50 minutes of sequencing [8] by placing reads onto a phylogenetic tree; and drug resistance profile of a S. aureus sample determined using a de-Bruijn graph approach from 8 hours of sequencing data [35].
We have shown that switching from a traditional short-read sequencing pipeline coupled with standard, non-streaming bioinformatics algorithms, to a nanopore sequencing pipeline coupled with streaming bioinformatics algorithms can dramatically cut the time taken from DNA library to results from at least 8 hours down to 30 minutes. With the time for library preparation for nanopore sequencing forecast to be shortened to 10 minutes, the major time bottleneck then becomes the bacterial culture step (which can be 24 hours). The MinION sequencer can be used on clinical sample without culture, however this then dilutes the proportion of bacterial DNA present. Nevertheless, this may become a viable time-sensitive strategy as sequencing yield increases, particularly with high colony-forming-unit (CFU) infections. Another promising approach may be to use approaches to pre-concentrate bacterial DNA [36].
One of the major advantages of a whole-genome sequencing approach to drug resistance profiling is that it is not necessary to restrict the analysis to a limited panel of drug-resistance tests but it is possible to discover the complete drug resistance profile in a sample. With a complete picture of the drug-resistance profile within a few hours, a clinician may be able to design an antibiotic treatment regimen that is both more likely to succeed and less likely to induce further antibiotic resistance. However, even achieving completely accurate identification of resistance genes is only a first step in accurately predicting the resistance profile, as mutations may effect the rate at which these genes are transcribed and also their antibiotic resistance activity. Prediction of antibiotic resistance from genotype is an area which warrants substantial further research.
Methods
DNA extraction
Bacterial strains K. pneumoniae ATCC BAA-2146, ATCC 700603, ATCC 13883, E. coli ATCC 25922 and S. aureus ATCC 25923 were obtained from American Type Culture Collection (ATCC, USA). Bacterial cultures were grown overnight from a single colony at 37°C with shaking (180 rpm). Whole cell DNA was extracted from the cultures using the DNeasy Blood and Tissue Kit (QIAGEN©, Cat #69504) according to the bacterial DNA extraction protocol with enzymatic lysis pre-treatment.
MinION library preparation – R7 Flow Cell
Library preparation was performed using the Genomic DNA Sequencing kit (SQK-MAP-002) (Oxford Nanopore) according to the manufacturer’s instruction. Briefly, 1μg of genomic DNA was sheared to 10kb fragment size using a Covaris g-TUBE. The sheared DNA was end repaired using the NEBNext End Repair Module (New England Biolabs) in a total volume of 100μL and incubated at 20°C for 30 minutes. The end repaired DNA was purified using 1x volume (100μL) Agencourt Ampure XP beads (Beckman Coulter) according to the manufacturer’s instructions. Purified end repair products were eluted in 42μL of molecular grade water and dA-tailing was performed using the NEBNext dA-tailing module (New England Biolabs) in a total volume of 50μL and incubated at 37°C for 30 minutes. Ligation was performed using the reagents supplied by Oxford Nanopore and T4 DNA ligase from New England Biolabs. The dA-tailed DNA was mixed with 10μL of adapter mix, 10μL of HP adapter, 20μL of 5x ligation buffer and 10μL of T4 DNA ligase (20000 units per reaction) and incubated at room temperature for 10 minutes. The adapter-ligated DNA was purified using 0.4x volume (40μL) Agencourt Ampure XP beads (Beckman Coulter) according to the manufacturer’s instructions with slight modifications. Oxford Nanopore supplied wash buffer and elution buffer was used and only a single wash was performed. Samples were eluted in 25μL of elution buffer. The ligated DNA was mixed with 10μL of tether and incubated at room temperature for 10 minutes. Finally, 15μL of HP motor was added to the reaction and incubated at room temperature for 16 hours.
MinION library preparation – R7.3 Flow Cell
For the R7.3 MinION Flow Cells an updated Genomic Sequencing kit (SQK-MAP-003) (Oxford Nanopore) was used according to the manufacturer’s instruction. Purified end repair products were eluted in 25μL of molecular grade water and dA-tailing was performed in a total volume of 30μL. The dA-tailed DNA was mixed with 10μL of adapter mix, 10μL of HP adapter and 50μL of Blunt/TA ligase master mix (New England Biolabs) and incubated at room temperature for 10 minutes. The adapter-ligated DNA was purified using 0.4x volume (40μL) Agencourt Ampure XP beads (Beckman Coulter) according to the manufacturer’s instructions with slight modifications. Oxford Nanopore supplied wash buffer and elution buffer was used and only a single wash was performed. Samples were eluted in 25μL of elution buffer.
For the library mixture sample, DNA concentration of each library was measured using Qubit Fluorimeter (Thermo Fisher Scientific). Based on the concentration, 75% of E. coli (ATCC 25922) library and 25% of S. aureus (ATCC 25923) library were mixed prior to sequencing.
MinION Sequencing
For each sample a new MinION Flow Cell (R7 or R7.3) was used for sequencing. The MinION Flow Cell was inserted into the MinION device and prior to sequencing, the Flow Cell was primed using 150μL of EP buffer twice with 10 minute incubation after each addition. The sequencing library mix was prepared by combining 6μL of library with 140μL of EP buffer and 4μL of fuel mix. The library mix was loaded onto the MinION Flow Cell and the Genomic DNA 48 hour sequencing protocol was initiated on the MinKNOW software. The MinION Flow Cell was topped up with fresh library mix for every 12 hours as required.
MinION data analysis
The sequence read data were base called with Met-richor Agent (https://metrichor.com). We used npReader [10] to convert base-called sequence data in fast5 format to fast5 format. The npReader program also extracted the time that each read was sequenced and used this information to sort the read sequences in order they were produced. For the real-time analyses, we wrote a program to emulate the sequencing process in that it streamlined each read in the exact order it was sequenced. The program also allowed scaling up the sequencing emulation to a factor of choice. Our pipeline allows for filtering out 1D reads at multiple stages (including via npReader). All subsequent analyses in this paper used both 1D and 2D reads.
MiSeq sequencing and data analysis
Library preparation was performed using the Nexter-aXT DNA Sample preparation kit (Illumina) as recommended by the manufacturer. Libraries were sequenced on the MiSeq instrument (Illumina) with 300bp paired end sequencing, to a coverage of over 100-fold. Read data were trimmed with trimmomatic [37] and subsequently assembled using SPAdes [38], resulting in assemblies with N50 exceeding 200kb. Their strain types were identified by submitting the assembled genomes to the MLST servers https://cge.cbs.dtu.dk/services/MLST/ [39] for K. pneumoniae, E. coli (set #1) and S. aureus.
We identified the antibiotic resistance profiles of these strains from their MiSeq assemblies. We used blastn to align these assemblies to the database of resistance genes obtained from resFinder [20]. Genes which were covered at least greater than 85% by the alignments and with greater than 85% sequence identity were considered to be present in the sample. These gene profiles were used as a benchmark to validate the MinION sequencing analysis.
Species typing
We downloaded the bacterial genome database on GenBank (ftp://ftp.ncbi.nlm.nih.gov/genomes/Bacteria/, accessed 19 Nov 2014), which contained high quality complete genomes of 2785 bacterial strains from 1487 bacteria species. Our species typing pipeline streamed read data from npReader directly to BWA-MEM [11] which aligned the reads to the database. Output from BWA in SAM format was streamed directly into our species typing pipeline, which calculated the proportion of reads aligned to each of these species. Our species typing method considers the proportions {p1,p2, .., pk} of k species in the mixture as the parameters of a k-category multinomial distribution, and the read counts {c1, c2, .., ck} for the species as an observation from c1 + c2 + .. + ck independent trials drawn from the distribution. It then uses the MultinomialCI package in R [40] to calculate the 95% confidence intervals of these proportions from the observation.
MLST typing
MinION sequence reads from K. pneumoniae strains were aligned to the seven house-keeping genes specified by the MLST system using BWA-MEM [11]. We then collected reads that were aligned to a gene and performed a multiple alignment on them using kalign2 [41]. The consensus sequence created from the multiple alignment was then globally aligned to all alleles of the gene using a probabilistic Finite State Machine (see below) for global alignment. The score of a MLST type was determined by the sum of the scores of seven alleles making up the type.
Strain typing
We built gene profile databases for K. pneumoniae, E. coli and S. aureus from the RefSeq annotation. Specifically, we obtained the publicly available assemblies of these species listed on RefSeq master database (ftp://ftp.ncbi.nih.gov/genomes/ASSEMBLY_REPORTS/assembly_summary_refseq.txt, accessed 17 July 2015). We used the relevant MLST schemes obtained from https://cge.cbs.dtu.dk/services/MLST/[39] to identify strain type of each assembly. For each strain type, we selected the assembly with highest N50 statistic and use the RefSeq gene annotation of the assembly to determine the gene content of the strain type.
In order to develop a simple probabilistic presence/absence strain typing model, we consider the genomes of each of the strains simply as a collection of genes. Denote by Stj=i..J the all the strains in our database (for a fixed species). Denote by gj,k the kth gene in the database for strain j, where the genes are listed in no particular order. Denote by Nj the total number of genes in Stj.
We align each sequence read ri from the MinION device to the gene database using BWA-MEM [11]. We count the number of genes of each strain that are aligned to some reads, denoted Nj(ri).
We describe below how we can calculate a likelihood, P(ri|Stj), of each strain generating each read, from which we can calculate the posterior probability of each strain Stj conditional on observing the reads r1 … rm:

The probability P (ri|Stj) could be calculated using a simple model as

however, this model suffers from the problem that if we observe any read which overlaps a gene not in the reference genome for Stj, then the posterior probability of that strain will become zero. Thus, this model is very unstable. In order to make this estimate more stable, we use a mixture model which allows for the read to have been generated by a background model:

The background model considers the probability that the read was generated from any of the strains:

This makes the posterior probability estimates more stable. It also makes the model robust to incorrect annotation of the reads from the MinION sequencer and incorrect annotation of the reference genome. We have investigated use of c = 0.2, c = 0.1 and c = 0.05 and found that it has little impact on the results, with slightly smaller confidence intervals (data not shown). We choose c = 0.2 in order to conservatively estimate confidence intervals.
Finally, in order to calculate confidence intervals we employ a bootstrap resampling approach in which we resample m reads from r1, ... rm with replacement. This is repeated 1000 times, and the posterior probabilities are recalculated every iteration. We calculate the 95% confidence intervals from the empirical distribution of these posterior probabilities.
To gain some insight into how this model works in response to gene presence, consider a gene g which is present in a fraction f of strains, including Stj but not including Stk. For simplicity assume that each strain has N genes. The difference in log-likelihood Stj and Stk conditional on g can be approximated by log(1/c) + log(1/f), showing that a more specific gene has a stronger effect in our model than a common gene in distinguishing strains.
To gain insight into the effect of gene absence in contrast to gene presence, assume instead that the only difference between Stj and Stk is that a single gene (g) is deleted in Stj, and denote by N = Nj = Nk – 1. If we sequence N ln(2) genes from Stj without seeing gene g, the difference in log-likelihood becomes N ln(2) * (log(N) − log(N − 1)) ≈ 1 bit, corresponding to the likelihood for Stj being twice as big as the likelihood of Stk For example, if a strain has 1000 genes, then we would need to observe 693 genes without observing g to be able to conclude that the observed data were twice as likely to be generated from the species with a single gene deletion. For comparison, we would need to only sequence 100 genes from Stk to get an expected log-likelihood difference of 1 bits versus Stj, demonstrating the extra information in gene ’presence’ versus ‘absence’ typing.
Antibiotic resistance gene classes detection
We downloaded the resistance gene database from res-Finder (https://cge.cbs.dtu.dk/services/ResFind/ accessed July 2015). We aligned each gene to the collection of bacterial genomes in RefSeq using blastn [42], and used the best alignment of the gene to extract 100bp flank sequences. We found that the inclusion of the 100 flank sequences improved the sensitivity of mapping MinION reads to the gene database.
We then grouped these genes based on 90% sequence identity into 609 groups. We manually checked and found genes within a group were variants of the same gene. We selected the longest gene in each group to make up a reduced resistance gene database. To create a benchmark of resistance gene for a sample, we blastn the Illumina assembly of the sample against this reduced gene database, and reported genes with greater than 85% coverage and identity.
Our analysis pipeline aligned MinION sequencing data into this reduced resistance gene database using BWA-MEM [11] in a streamline fashion, and examined genes that had reads mapping to the whole gene (not including flanking sequences). Due to the high error rates of MinION sequence data, we noticed a high rate of false positive genes. To reduce false positives, we used kalign2 [41] to perform a multiple alignment of reads that were aligned to the same gene. The consensus sequence resulting from the multiple alignment was then compared with the gene sequence using a probabilistic Finite State Machine (see below). The pipeline then reported gene classes based on the genes detected.
Sensitive alignment of noisy sequences with probabilistic Finite State Machines
Our methods for MLST strain typing and antibiotic resistance gene identification require the alignment of a consensus sequence to a gene or a gene allele. Such an alignment generally assumes a model and a set of parameters of the differences between the sequences. It is widely recognised that the accuracy of the alignment is sensitive to these parameters [43–45]. However, in the context of real-time analysis of MinION sequencing, it is not possible to select in advance a sensible set of parameters. On the one hand, the quality among sequence reads differs remarkably; as shown in Figure 3 and Table 2 – the majority (95%) of the reads across our four runs have the Phred score ranging between 3 and 7 for template and complement reads (corresponding to 50% – 80% accuracy) and between 6 to 12 for 2D reads (75%-95% accuracy). On the other hand, a consensus sequence is computationally constructed from a set of reads. Its quality is hence contingent to not only the quality of the reads but also the number of reads in the set.
We use a probabilistic Finite State Machine (pFSM) [46] to model the differences, and hence the simultaneous er’ror profile of the consensus sequence. The pFSM consists of a set of states and transitions between states. Each transition corresponds to an action and is associated with a cost for the action. An action could be one of copy (C), substitute (S), delete (D) and insert (I). Figure 6 depicts a three-state pFSM which is equivalent to a affine gap penalty alignment model. In order to assess an alignment of two sequences A and B, under a hypothesis specified by the parameters, the pFSM computes the cost to generate one sequence (say A) given the other (B). For example, while in state Copy, the machine consumes the next base in B, generates the next base in A; it is said to take action C if the two bases are the same, or action S otherwise, and to follow either transition to state Copy. Alternatively, the machine can take either action D (consumes the next base in B without generating any base in A and moves to state Delete), or action I (generates the next base in A without consuming a base in B and moves to state Insert). These actions are repeated until the whole sequence B is generated.

Schematic of a three-state probabilistic Finite State Machine.
We use an information-theoretic measure where the cost of a transition is that of encoding the generated base, or in other words, the negative logarithm of the probability of the associated action (c = −log2(P(a)). The foundation of this approach goes back to the 1960s when it was proposed as a basis for inductive inference [47, 48]. It has since been used in a number of bioinformatics applications such as for calculating the BLOSUM matrix [49] and modelling DNA sequences [50, 51]. More importantly, this information-theoretic framework allows one to estimate a sensible set of parameters for any related two sequences. This is done via a Expectation-Maximisation process. This starts with an initial set of probabilities at each state. In the E-step, the best alignment (lowest cost) is calculated by a dynamic programming algorithm. The frequencies of actions at each state are then used to re-estimate the probabilities in the M-step. A detailed discussion of this process is provided in Allison et al [46] and Cao et al [52]. The process is guaranteed to converse to an optimal, and it does so in only a few iterations in our experience.
Availability of supporting data
All scripts for the presented analyses are provided in https://github.com/mdcao/np Analysis. The source code of the software is publicly available in github repository (https://github.com/mdcao/japsa). The MinION sequencing data for the three single samples are available in European Nucleotide Archive Study Accession Number ERP010377 (http://www.ebi.ac.uk/ena/data/view/ERP010377). The MinION sequencing data for mixture sample and the Illumina sequencing are in the process of depositing to European Nucleotide Archive. They are made available via the links provided in https://github.com/mdcao/npAnalysis.
List of abbreviations used
MLST: Multilocus sequence typing; pFSM: probabilistic Finite State Machine.
Competing interests
MC is a participant of Oxford Nanopore’s MinION Access Programme (MAP) and received the MinION device, MinION Flow Cells and Oxford Nanopore Sequencing Kits in return for an early access fee deposit. None of the authors have any commercial or financial interest in Oxford Nanopore Technologies Ltd.
Author’s contributions
MDC, DG, MC and LC conceived the study, performed the analysis and wrote the first draft of the manuscript. AE performed the bacterial cultures and DNA extractions. DG performed the MinION sequencing. MDC and LC designed and developed the algorithms and the analysis framework. MDC, HZ, and LC performed the bioinformatics analyses. All authors contributed to editing the final manuscript.
References


